

206
W. Zhou et al.
magnitude of amplitude reveals the damage degree of materials. It can be seen that
after the first loading, the detected AE frequency do not exceed 100 kHz and the
duration is concentrated within 4000 µs, while the amplitude signals are mainly
distributed in the range of 40–45 dB, indicating that the damage of specimen is very
slight at this time. Performed again loaded (see Fig. 18.4b), the values of duration,
amplitude and frequency are significantly increased, and a large number of AE signals
revealed the occurrence of damage of the specimen. In addition, it is found that the
duration of the high frequency signal is short. These signals are primarily detected
at the moment of matrix cracking and fiber breakage. After that, the 3rd load is
executed, a large number of signals greater than 70 dB appear, the frequency and
duration exceed 350 kHz and 20,000 µs respectively, and the distributions of AE
signals are more dense and rich. On the other hand, AE signals of high amplitude
and high duration appeared, indicating that continuous damage similar to debonding
and delamination are aggravated in the specimen and combined with matrix cracking
and fiber breakage resulted in failure of the material.
To sum up, the AE parameters such as accumulated counts, amplitude, duration
and frequency can better describe the damage accumulation and failure process of
composite. In order to understand the stress of the specimen more clearly, the strain
field and displacement field of the material are obtained by calculating.
18.3.3 Displacement Field and Strain Field Distribution
of Composite Specimens
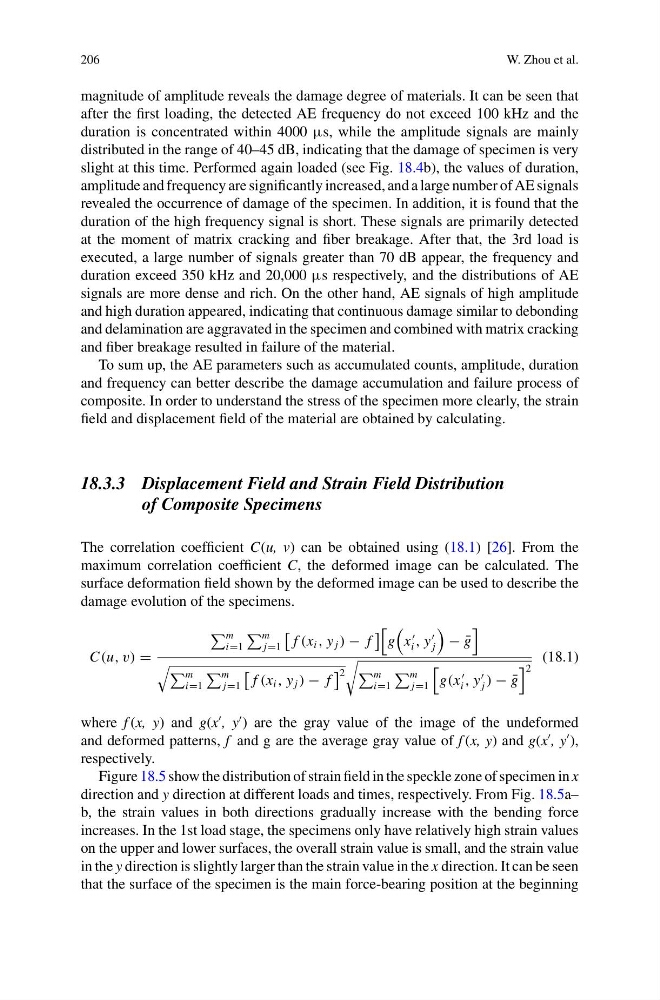
The correlation coefficient C(u, v) can be obtained using (18.1) [26]. From the
maximum correlation coefficient C, the deformed image can be calculated. The
surface deformation field shown by the deformed image can be used to describe the
damage evolution of the specimens.
C(u, v) =
m
i=1
m
j=1
f (x i , y j ) − f
g
x
i , y
j
− ¯
g
m
i=1
m
j=1
f (x i , y j ) − f
2
m
i=1
m
j=1
g(x
i , y
j ) − ¯
g
2
(18.1)
where f (x, y) and g(x
, y
) are the gray value of the image of the undeformed
and deformed patterns, f and g are the average gray value of f (x, y) and g(x
, y
),
respectively.
Figure 18.5 show the distribution of strain field in the speckle zone of specimen in x
direction and y direction at different loads and times, respectively. From Fig. 18.5a–
b, the strain values in both directions gradually increase with the bending force
increases. In the 1st load stage, the specimens only have relatively high strain values
on the upper and lower surfaces, the overall strain value is small, and the strain value
in the y direction is slightly larger than the strain value in the x direction. It can be seen
that the surface of the specimen is the main force-bearing position at the beginning
W. Zhou et al.
magnitude of amplitude reveals the damage degree of materials. It can be seen that
after the first loading, the detected AE frequency do not exceed 100 kHz and the
duration is concentrated within 4000 µs, while the amplitude signals are mainly
distributed in the range of 40–45 dB, indicating that the damage of specimen is very
slight at this time. Performed again loaded (see Fig. 18.4b), the values of duration,
amplitude and frequency are significantly increased, and a large number of AE signals
revealed the occurrence of damage of the specimen. In addition, it is found that the
duration of the high frequency signal is short. These signals are primarily detected
at the moment of matrix cracking and fiber breakage. After that, the 3rd load is
executed, a large number of signals greater than 70 dB appear, the frequency and
duration exceed 350 kHz and 20,000 µs respectively, and the distributions of AE
signals are more dense and rich. On the other hand, AE signals of high amplitude
and high duration appeared, indicating that continuous damage similar to debonding
and delamination are aggravated in the specimen and combined with matrix cracking
and fiber breakage resulted in failure of the material.
To sum up, the AE parameters such as accumulated counts, amplitude, duration
and frequency can better describe the damage accumulation and failure process of
composite. In order to understand the stress of the specimen more clearly, the strain
field and displacement field of the material are obtained by calculating.
18.3.3 Displacement Field and Strain Field Distribution
of Composite Specimens
The correlation coefficient C(u, v) can be obtained using (18.1) [26]. From the
maximum correlation coefficient C, the deformed image can be calculated. The
surface deformation field shown by the deformed image can be used to describe the
damage evolution of the specimens.
C(u, v) =
m
i=1
m
j=1
f (x i , y j ) − f
g
x
i , y
j
− ¯
g
m
i=1
m
j=1
f (x i , y j ) − f
2
m
i=1
m
j=1
g(x
i , y
j ) − ¯
g
2
(18.1)
where f (x, y) and g(x
, y
) are the gray value of the image of the undeformed
and deformed patterns, f and g are the average gray value of f (x, y) and g(x
, y
),
respectively.
Figure 18.5 show the distribution of strain field in the speckle zone of specimen in x
direction and y direction at different loads and times, respectively. From Fig. 18.5a–
b, the strain values in both directions gradually increase with the bending force
increases. In the 1st load stage, the specimens only have relatively high strain values
on the upper and lower surfaces, the overall strain value is small, and the strain value
in the y direction is slightly larger than the strain value in the x direction. It can be seen
that the surface of the specimen is the main force-bearing position at the beginning