

18 Investigation of Flexural Progressive …
203
Table 18.1 Failure loads and AE distribution of the composite specimens
Group
Load/kN Average
failure
loads/kN
Bending
strength/MPa
Average
bending
strength/MPa
Amplitude
range/dB
Accumulated
counts
Group 1 6.51
848.7
40.06–95.76 14,097
Group 2 6.00
5.86
782.3
764.5
40.06–91.00 13,442
Group 3 5.09
663.6
40.06–97.58 14,686
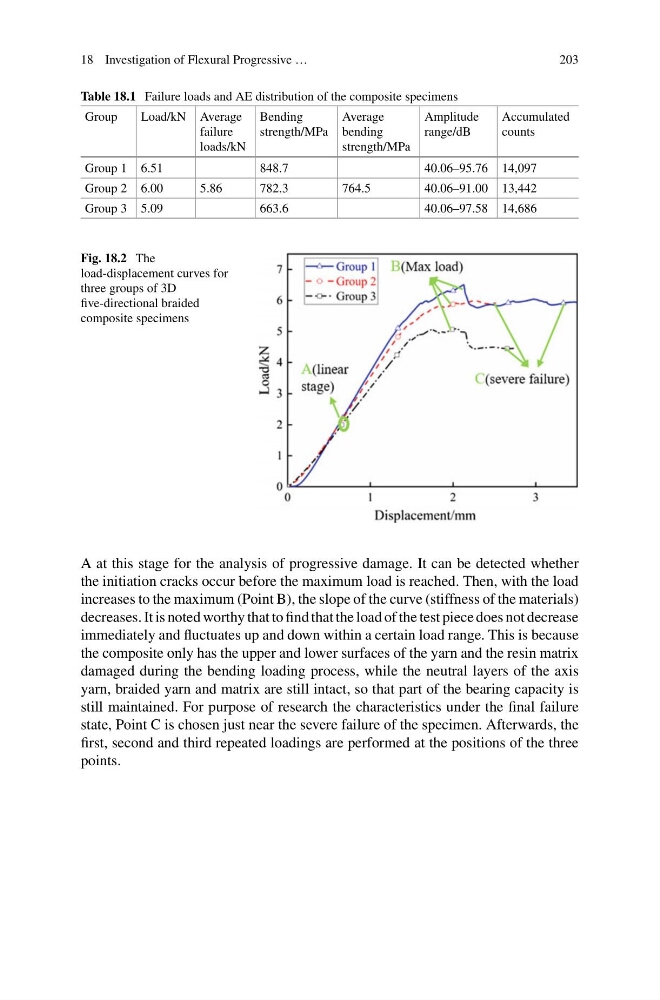
Fig. 18.2 The
load-displacement curves for
three groups of 3D
five-directional braided
composite specimens
A at this stage for the analysis of progressive damage. It can be detected whether
the initiation cracks occur before the maximum load is reached. Then, with the load
increases to the maximum (Point B), the slope of the curve (stiffness of the materials)
decreases. It is noted worthy that to find that the load of the test piece does not decrease
immediately and fluctuates up and down within a certain load range. This is because
the composite only has the upper and lower surfaces of the yarn and the resin matrix
damaged during the bending loading process, while the neutral layers of the axis
yarn, braided yarn and matrix are still intact, so that part of the bearing capacity is
still maintained. For purpose of research the characteristics under the final failure
state, Point C is chosen just near the severe failure of the specimen. Afterwards, the
first, second and third repeated loadings are performed at the positions of the three
points.
203
Table 18.1 Failure loads and AE distribution of the composite specimens
Group
Load/kN Average
failure
loads/kN
Bending
strength/MPa
Average
bending
strength/MPa
Amplitude
range/dB
Accumulated
counts
Group 1 6.51
848.7
40.06–95.76 14,097
Group 2 6.00
5.86
782.3
764.5
40.06–91.00 13,442
Group 3 5.09
663.6
40.06–97.58 14,686
Fig. 18.2 The
load-displacement curves for
three groups of 3D
five-directional braided
composite specimens
A at this stage for the analysis of progressive damage. It can be detected whether
the initiation cracks occur before the maximum load is reached. Then, with the load
increases to the maximum (Point B), the slope of the curve (stiffness of the materials)
decreases. It is noted worthy that to find that the load of the test piece does not decrease
immediately and fluctuates up and down within a certain load range. This is because
the composite only has the upper and lower surfaces of the yarn and the resin matrix
damaged during the bending loading process, while the neutral layers of the axis
yarn, braided yarn and matrix are still intact, so that part of the bearing capacity is
still maintained. For purpose of research the characteristics under the final failure
state, Point C is chosen just near the severe failure of the specimen. Afterwards, the
first, second and third repeated loadings are performed at the positions of the three
points.