

16 Research on Extraction Method of Fatigue …
179
0
100
200
300
400
0
0.01
0.02
0.03
0.04
0.05
0.06
0
100
200
300
400
50
55
60
65
70
75
80
0
100
200
300
400
0.4
0.6
0.8
1
1.2
1.4
1.6
x 10
-3
1 2
3
5
6
4
Static load (Mpa)
(a) Energy
Energy
Static load (Mpa)
(b) Amplitude
Amplitude (dB)
1
2 3
4
5
6
RMS voltage (mV)
1
2
3
4
5 6
Static load (Mpa)
(c) RMS voltage
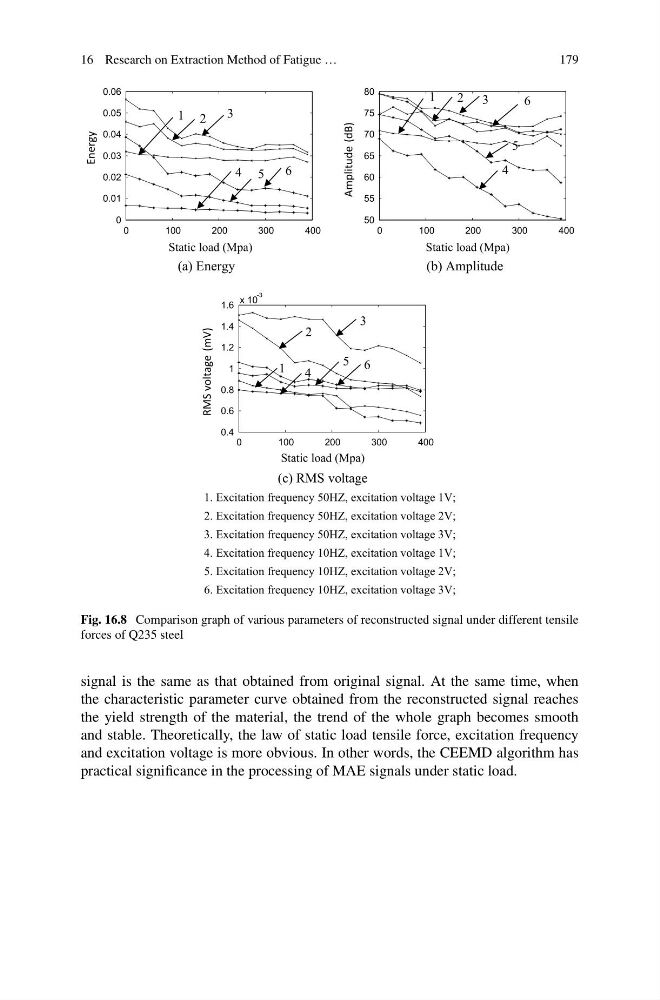
1. Excitation frequency 50HZ, excitation voltage 1V;
2. Excitation frequency 50HZ, excitation voltage 2V;
3. Excitation frequency 50HZ, excitation voltage 3V;
4. Excitation frequency 10HZ, excitation voltage 1V;
5. Excitation frequency 10HZ, excitation voltage 2V;
6. Excitation frequency 10HZ, excitation voltage 3V;
Fig. 16.8 Comparison graph of various parameters of reconstructed signal under different tensile
forces of Q235 steel
signal is the same as that obtained from original signal. At the same time, when
the characteristic parameter curve obtained from the reconstructed signal reaches
the yield strength of the material, the trend of the whole graph becomes smooth
and stable. Theoretically, the law of static load tensile force, excitation frequency
and excitation voltage is more obvious. In other words, the CEEMD algorithm has
practical significance in the processing of MAE signals under static load.
179
0
100
200
300
400
0
0.01
0.02
0.03
0.04
0.05
0.06
0
100
200
300
400
50
55
60
65
70
75
80
0
100
200
300
400
0.4
0.6
0.8
1
1.2
1.4
1.6
x 10
-3
1 2
3
5
6
4
Static load (Mpa)
(a) Energy
Energy
Static load (Mpa)
(b) Amplitude
Amplitude (dB)
1
2 3
4
5
6
RMS voltage (mV)
1
2
3
4
5 6
Static load (Mpa)
(c) RMS voltage
1. Excitation frequency 50HZ, excitation voltage 1V;
2. Excitation frequency 50HZ, excitation voltage 2V;
3. Excitation frequency 50HZ, excitation voltage 3V;
4. Excitation frequency 10HZ, excitation voltage 1V;
5. Excitation frequency 10HZ, excitation voltage 2V;
6. Excitation frequency 10HZ, excitation voltage 3V;
Fig. 16.8 Comparison graph of various parameters of reconstructed signal under different tensile
forces of Q235 steel
signal is the same as that obtained from original signal. At the same time, when
the characteristic parameter curve obtained from the reconstructed signal reaches
the yield strength of the material, the trend of the whole graph becomes smooth
and stable. Theoretically, the law of static load tensile force, excitation frequency
and excitation voltage is more obvious. In other words, the CEEMD algorithm has
practical significance in the processing of MAE signals under static load.