

16 Research on Extraction Method of Fatigue …
177
0
100
200
300
400
0
0.05
0.1
0.15
0.2
0
100
200
300
400
72
74
76
78
80
82
84
0
100
200
300
400
1
1.5
2
2.5
3
3.5
4
x 10
-3
1 2 3
4
5
6
Static load (Mpa)
(a) Energy
Energy
1
3
2
4
5
6
Static load (Mpa)
(b) Amplitude
Amplitude (dB)
1
2
4
5 6
3
Static load (Mpa)
(c) RMS voltage
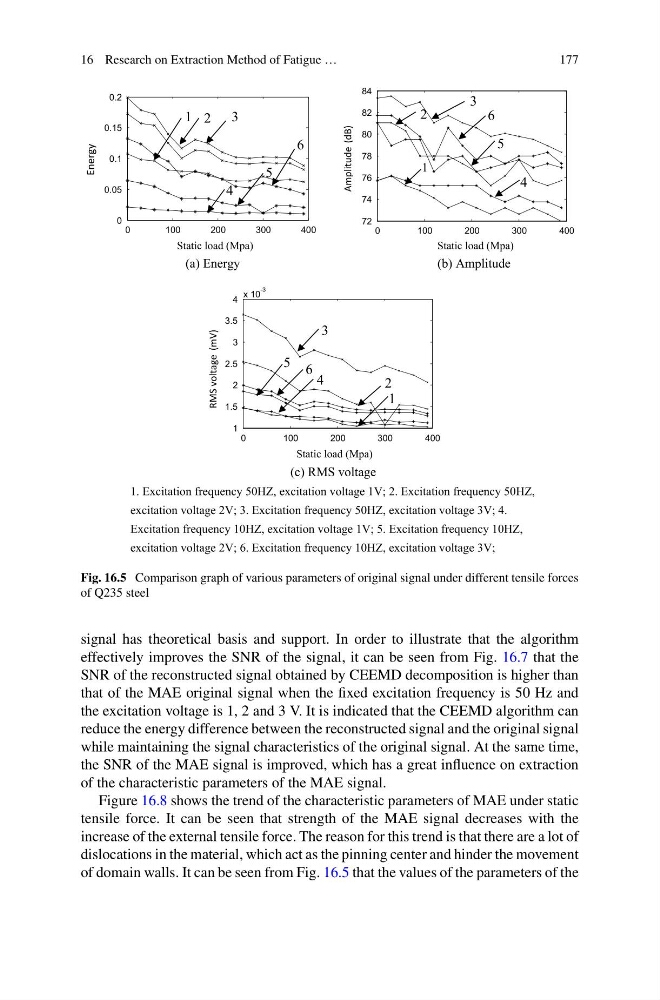
1. Excitation frequency 50HZ, excitation voltage 1V; 2. Excitation frequency 50HZ,
excitation voltage 2V; 3. Excitation frequency 50HZ, excitation voltage 3V; 4.
Excitation frequency 10HZ, excitation voltage 1V; 5. Excitation frequency 10HZ,
excitation voltage 2V; 6. Excitation frequency 10HZ, excitation voltage 3V;
RMS voltage (mV)
Fig. 16.5 Comparison graph of various parameters of original signal under different tensile forces
of Q235 steel
signal has theoretical basis and support. In order to illustrate that the algorithm
effectively improves the SNR of the signal, it can be seen from Fig. 16.7 that the
SNR of the reconstructed signal obtained by CEEMD decomposition is higher than
that of the MAE original signal when the fixed excitation frequency is 50 Hz and
the excitation voltage is 1, 2 and 3 V. It is indicated that the CEEMD algorithm can
reduce the energy difference between the reconstructed signal and the original signal
while maintaining the signal characteristics of the original signal. At the same time,
the SNR of the MAE signal is improved, which has a great influence on extraction
of the characteristic parameters of the MAE signal.
Figure 16.8 shows the trend of the characteristic parameters of MAE under static
tensile force. It can be seen that strength of the MAE signal decreases with the
increase of the external tensile force. The reason for this trend is that there are a lot of
dislocations in the material, which act as the pinning center and hinder the movement
of domain walls. It can be seen from Fig. 16.5 that the values of the parameters of the
177
0
100
200
300
400
0
0.05
0.1
0.15
0.2
0
100
200
300
400
72
74
76
78
80
82
84
0
100
200
300
400
1
1.5
2
2.5
3
3.5
4
x 10
-3
1 2 3
4
5
6
Static load (Mpa)
(a) Energy
Energy
1
3
2
4
5
6
Static load (Mpa)
(b) Amplitude
Amplitude (dB)
1
2
4
5 6
3
Static load (Mpa)
(c) RMS voltage
1. Excitation frequency 50HZ, excitation voltage 1V; 2. Excitation frequency 50HZ,
excitation voltage 2V; 3. Excitation frequency 50HZ, excitation voltage 3V; 4.
Excitation frequency 10HZ, excitation voltage 1V; 5. Excitation frequency 10HZ,
excitation voltage 2V; 6. Excitation frequency 10HZ, excitation voltage 3V;
RMS voltage (mV)
Fig. 16.5 Comparison graph of various parameters of original signal under different tensile forces
of Q235 steel
signal has theoretical basis and support. In order to illustrate that the algorithm
effectively improves the SNR of the signal, it can be seen from Fig. 16.7 that the
SNR of the reconstructed signal obtained by CEEMD decomposition is higher than
that of the MAE original signal when the fixed excitation frequency is 50 Hz and
the excitation voltage is 1, 2 and 3 V. It is indicated that the CEEMD algorithm can
reduce the energy difference between the reconstructed signal and the original signal
while maintaining the signal characteristics of the original signal. At the same time,
the SNR of the MAE signal is improved, which has a great influence on extraction
of the characteristic parameters of the MAE signal.
Figure 16.8 shows the trend of the characteristic parameters of MAE under static
tensile force. It can be seen that strength of the MAE signal decreases with the
increase of the external tensile force. The reason for this trend is that there are a lot of
dislocations in the material, which act as the pinning center and hinder the movement
of domain walls. It can be seen from Fig. 16.5 that the values of the parameters of the