

130
Y. Yu et al.
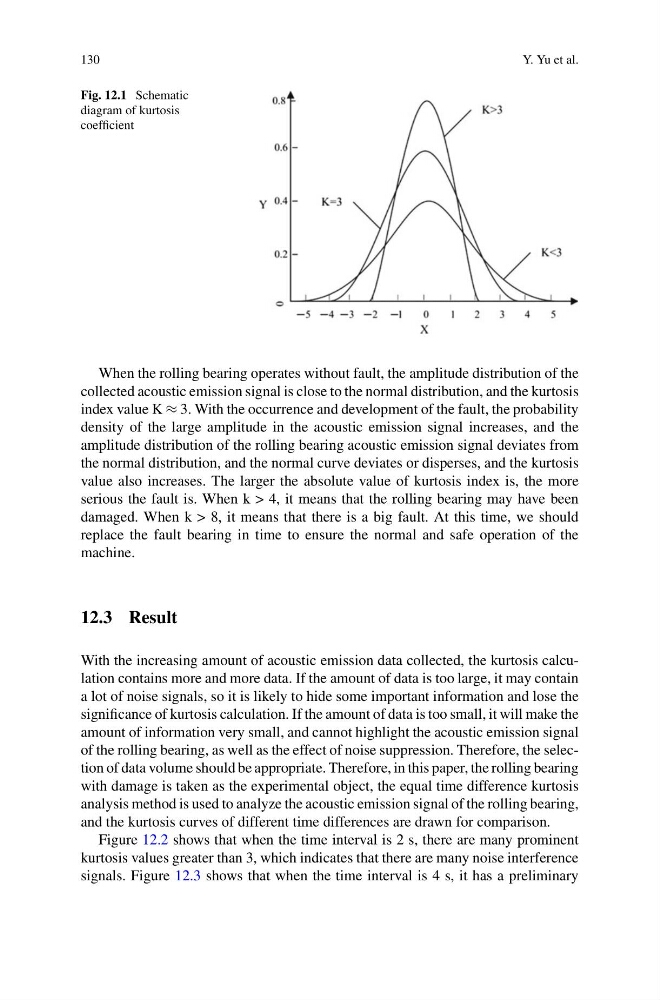
Fig. 12.1 Schematic
diagram of kurtosis
coefficient
When the rolling bearing operates without fault, the amplitude distribution of the
collected acoustic emission signal is close to the normal distribution, and the kurtosis
index value K ≈ 3. With the occurrence and development of the fault, the probability
density of the large amplitude in the acoustic emission signal increases, and the
amplitude distribution of the rolling bearing acoustic emission signal deviates from
the normal distribution, and the normal curve deviates or disperses, and the kurtosis
value also increases. The larger the absolute value of kurtosis index is, the more
serious the fault is. When k > 4, it means that the rolling bearing may have been
damaged. When k > 8, it means that there is a big fault. At this time, we should
replace the fault bearing in time to ensure the normal and safe operation of the
machine.
12.3 Result
With the increasing amount of acoustic emission data collected, the kurtosis calculation contains more and more data. If the amount of data is too large, it may contain
a lot of noise signals, so it is likely to hide some important information and lose the
significance of kurtosis calculation. If the amount of data is too small, it will make the
amount of information very small, and cannot highlight the acoustic emission signal
of the rolling bearing, as well as the effect of noise suppression. Therefore, the selection of data volume should be appropriate. Therefore, in this paper, the rolling bearing
with damage is taken as the experimental object, the equal time difference kurtosis
analysis method is used to analyze the acoustic emission signal of the rolling bearing,
and the kurtosis curves of different time differences are drawn for comparison.
Figure 12.2 shows that when the time interval is 2 s, there are many prominent
kurtosis values greater than 3, which indicates that there are many noise interference
signals. Figure 12.3 shows that when the time interval is 4 s, it has a preliminary
Y. Yu et al.
Fig. 12.1 Schematic
diagram of kurtosis
coefficient
When the rolling bearing operates without fault, the amplitude distribution of the
collected acoustic emission signal is close to the normal distribution, and the kurtosis
index value K ≈ 3. With the occurrence and development of the fault, the probability
density of the large amplitude in the acoustic emission signal increases, and the
amplitude distribution of the rolling bearing acoustic emission signal deviates from
the normal distribution, and the normal curve deviates or disperses, and the kurtosis
value also increases. The larger the absolute value of kurtosis index is, the more
serious the fault is. When k > 4, it means that the rolling bearing may have been
damaged. When k > 8, it means that there is a big fault. At this time, we should
replace the fault bearing in time to ensure the normal and safe operation of the
machine.
12.3 Result
With the increasing amount of acoustic emission data collected, the kurtosis calculation contains more and more data. If the amount of data is too large, it may contain
a lot of noise signals, so it is likely to hide some important information and lose the
significance of kurtosis calculation. If the amount of data is too small, it will make the
amount of information very small, and cannot highlight the acoustic emission signal
of the rolling bearing, as well as the effect of noise suppression. Therefore, the selection of data volume should be appropriate. Therefore, in this paper, the rolling bearing
with damage is taken as the experimental object, the equal time difference kurtosis
analysis method is used to analyze the acoustic emission signal of the rolling bearing,
and the kurtosis curves of different time differences are drawn for comparison.
Figure 12.2 shows that when the time interval is 2 s, there are many prominent
kurtosis values greater than 3, which indicates that there are many noise interference
signals. Figure 12.3 shows that when the time interval is 4 s, it has a preliminary