

12 Application of Kurtosis Analysis in Fault Detection …
129
and kurtosis K reflects the deviation. The more serious the fault is, the greater the
deviation degree is and the greater the kurtosis value is.
12.2.1 Equal Time Difference Kurtosis Analysis Method
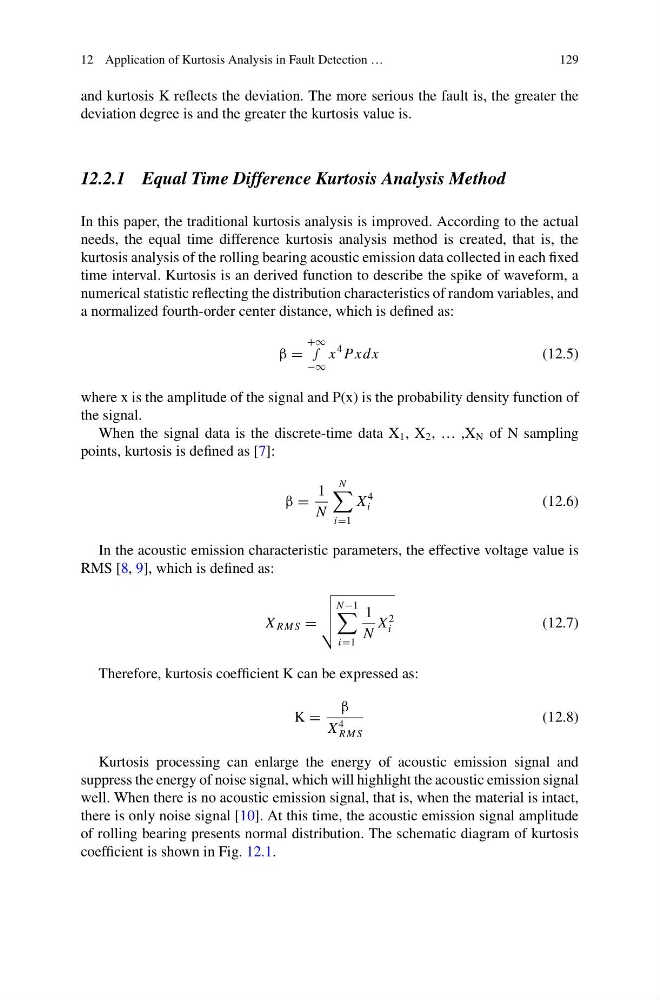
In this paper, the traditional kurtosis analysis is improved. According to the actual
needs, the equal time difference kurtosis analysis method is created, that is, the
kurtosis analysis of the rolling bearing acoustic emission data collected in each fixed
time interval. Kurtosis is an derived function to describe the spike of waveform, a
numerical statistic reflecting the distribution characteristics of random variables, and
a normalized fourth-order center distance, which is defined as:
β =
+∞
∫
−∞
x
4 Pxdx
(12.5)
where x is the amplitude of the signal and P(x) is the probability density function of
the signal.
When the signal data is the discrete-time data X 1 , X 2 , … ,X N of N sampling
points, kurtosis is defined as [7]:
β =
1
N
N
i=1
X
4
i
(12.6)
In the acoustic emission characteristic parameters, the effective voltage value is
RMS [8, 9], which is defined as:
X RM S =
N −1
i=1
1
N
X
2
i
(12.7)
Therefore, kurtosis coefficient K can be expressed as:
K =
β
X
4
RM S
(12.8)
Kurtosis processing can enlarge the energy of acoustic emission signal and
suppress the energy of noise signal, which will highlight the acoustic emission signal
well. When there is no acoustic emission signal, that is, when the material is intact,
there is only noise signal [10]. At this time, the acoustic emission signal amplitude
of rolling bearing presents normal distribution. The schematic diagram of kurtosis
coefficient is shown in Fig. 12.1.
129
and kurtosis K reflects the deviation. The more serious the fault is, the greater the
deviation degree is and the greater the kurtosis value is.
12.2.1 Equal Time Difference Kurtosis Analysis Method
In this paper, the traditional kurtosis analysis is improved. According to the actual
needs, the equal time difference kurtosis analysis method is created, that is, the
kurtosis analysis of the rolling bearing acoustic emission data collected in each fixed
time interval. Kurtosis is an derived function to describe the spike of waveform, a
numerical statistic reflecting the distribution characteristics of random variables, and
a normalized fourth-order center distance, which is defined as:
β =
+∞
∫
−∞
x
4 Pxdx
(12.5)
where x is the amplitude of the signal and P(x) is the probability density function of
the signal.
When the signal data is the discrete-time data X 1 , X 2 , … ,X N of N sampling
points, kurtosis is defined as [7]:
β =
1
N
N
i=1
X
4
i
(12.6)
In the acoustic emission characteristic parameters, the effective voltage value is
RMS [8, 9], which is defined as:
X RM S =
N −1
i=1
1
N
X
2
i
(12.7)
Therefore, kurtosis coefficient K can be expressed as:
K =
β
X
4
RM S
(12.8)
Kurtosis processing can enlarge the energy of acoustic emission signal and
suppress the energy of noise signal, which will highlight the acoustic emission signal
well. When there is no acoustic emission signal, that is, when the material is intact,
there is only noise signal [10]. At this time, the acoustic emission signal amplitude
of rolling bearing presents normal distribution. The schematic diagram of kurtosis
coefficient is shown in Fig. 12.1.