

112
W. Xinying et al.
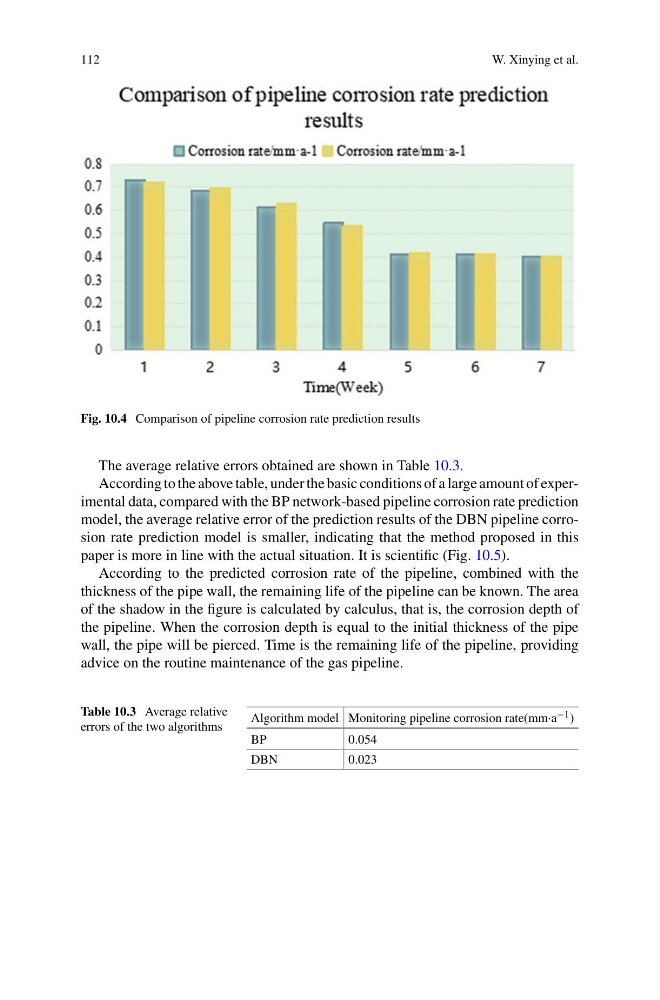
Fig. 10.4 Comparison of pipeline corrosion rate prediction results
The average relative errors obtained are shown in Table 10.3.
According to the above table, under the basic conditions of a large amount of experimental data, compared with the BP network-based pipeline corrosion rate prediction
model, the average relative error of the prediction results of the DBN pipeline corrosion rate prediction model is smaller, indicating that the method proposed in this
paper is more in line with the actual situation. It is scientific (Fig. 10.5).
According to the predicted corrosion rate of the pipeline, combined with the
thickness of the pipe wall, the remaining life of the pipeline can be known. The area
of the shadow in the figure is calculated by calculus, that is, the corrosion depth of
the pipeline. When the corrosion depth is equal to the initial thickness of the pipe
wall, the pipe will be pierced. Time is the remaining life of the pipeline, providing
advice on the routine maintenance of the gas pipeline.
Table 10.3 Average relative
errors of the two algorithms
Algorithm model Monitoring pipeline corrosion rate(mm·a −1 )
BP
0.054
DBN
0.023
W. Xinying et al.
Fig. 10.4 Comparison of pipeline corrosion rate prediction results
The average relative errors obtained are shown in Table 10.3.
According to the above table, under the basic conditions of a large amount of experimental data, compared with the BP network-based pipeline corrosion rate prediction
model, the average relative error of the prediction results of the DBN pipeline corrosion rate prediction model is smaller, indicating that the method proposed in this
paper is more in line with the actual situation. It is scientific (Fig. 10.5).
According to the predicted corrosion rate of the pipeline, combined with the
thickness of the pipe wall, the remaining life of the pipeline can be known. The area
of the shadow in the figure is calculated by calculus, that is, the corrosion depth of
the pipeline. When the corrosion depth is equal to the initial thickness of the pipe
wall, the pipe will be pierced. Time is the remaining life of the pipeline, providing
advice on the routine maintenance of the gas pipeline.
Table 10.3 Average relative
errors of the two algorithms
Algorithm model Monitoring pipeline corrosion rate(mm·a −1 )
BP
0.054
DBN
0.023