

8 Acoustic Emission and Dual-Tree Complex Wavelet Transform …
83
amplitudes. Therefore, the coefficients which are smaller than the threshold can be
eliminated as noise. Lastly, remaining coefficients will be reconstructed.
The performance of wavelet de-noising is greatly affected by the selection of
decomposition level, threshold method and the threshold value. De-noising with
high level may result in loss of excessive information meanwhile de-noising effect
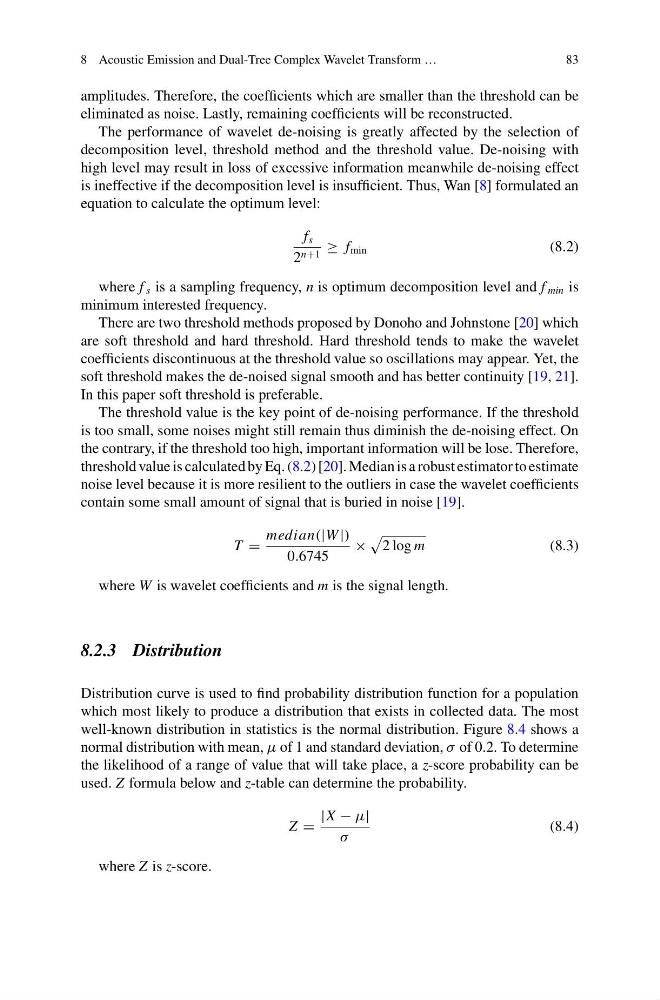
is ineffective if the decomposition level is insufficient. Thus, Wan [8] formulated an
equation to calculate the optimum level:
f s
2 n+1 ≥ f min
(8.2)
where f s is a sampling frequency, n is optimum decomposition level and f min is
minimum interested frequency.
There are two threshold methods proposed by Donoho and Johnstone [20] which
are soft threshold and hard threshold. Hard threshold tends to make the wavelet
coefficients discontinuous at the threshold value so oscillations may appear. Yet, the
soft threshold makes the de-noised signal smooth and has better continuity [19, 21].
In this paper soft threshold is preferable.
The threshold value is the key point of de-noising performance. If the threshold
is too small, some noises might still remain thus diminish the de-noising effect. On
the contrary, if the threshold too high, important information will be lose. Therefore,
threshold value is calculated by Eq. (8.2) [20]. Median is a robust estimator to estimate
noise level because it is more resilient to the outliers in case the wavelet coefficients
contain some small amount of signal that is buried in noise [19].
T =
median(|W |)
0.6745
×
2 log m
(8.3)
where W is wavelet coefficients and m is the signal length.
8.2.3 Distribution
Distribution curve is used to find probability distribution function for a population
which most likely to produce a distribution that exists in collected data. The most
well-known distribution in statistics is the normal distribution. Figure 8.4 shows a
normal distribution with mean, μ of 1 and standard deviation, σ of 0.2. To determine
the likelihood of a range of value that will take place, a z-score probability can be
used. Z formula below and z-table can determine the probability.
Z =
|X − μ|
σ
(8.4)
where Z is z-score.
83
amplitudes. Therefore, the coefficients which are smaller than the threshold can be
eliminated as noise. Lastly, remaining coefficients will be reconstructed.
The performance of wavelet de-noising is greatly affected by the selection of
decomposition level, threshold method and the threshold value. De-noising with
high level may result in loss of excessive information meanwhile de-noising effect
is ineffective if the decomposition level is insufficient. Thus, Wan [8] formulated an
equation to calculate the optimum level:
f s
2 n+1 ≥ f min
(8.2)
where f s is a sampling frequency, n is optimum decomposition level and f min is
minimum interested frequency.
There are two threshold methods proposed by Donoho and Johnstone [20] which
are soft threshold and hard threshold. Hard threshold tends to make the wavelet
coefficients discontinuous at the threshold value so oscillations may appear. Yet, the
soft threshold makes the de-noised signal smooth and has better continuity [19, 21].
In this paper soft threshold is preferable.
The threshold value is the key point of de-noising performance. If the threshold
is too small, some noises might still remain thus diminish the de-noising effect. On
the contrary, if the threshold too high, important information will be lose. Therefore,
threshold value is calculated by Eq. (8.2) [20]. Median is a robust estimator to estimate
noise level because it is more resilient to the outliers in case the wavelet coefficients
contain some small amount of signal that is buried in noise [19].
T =
median(|W |)
0.6745
×
2 log m
(8.3)
where W is wavelet coefficients and m is the signal length.
8.2.3 Distribution
Distribution curve is used to find probability distribution function for a population
which most likely to produce a distribution that exists in collected data. The most
well-known distribution in statistics is the normal distribution. Figure 8.4 shows a
normal distribution with mean, μ of 1 and standard deviation, σ of 0.2. To determine
the likelihood of a range of value that will take place, a z-score probability can be
used. Z formula below and z-table can determine the probability.
Z =
|X − μ|
σ
(8.4)
where Z is z-score.