

544
V. S. Simi et al.
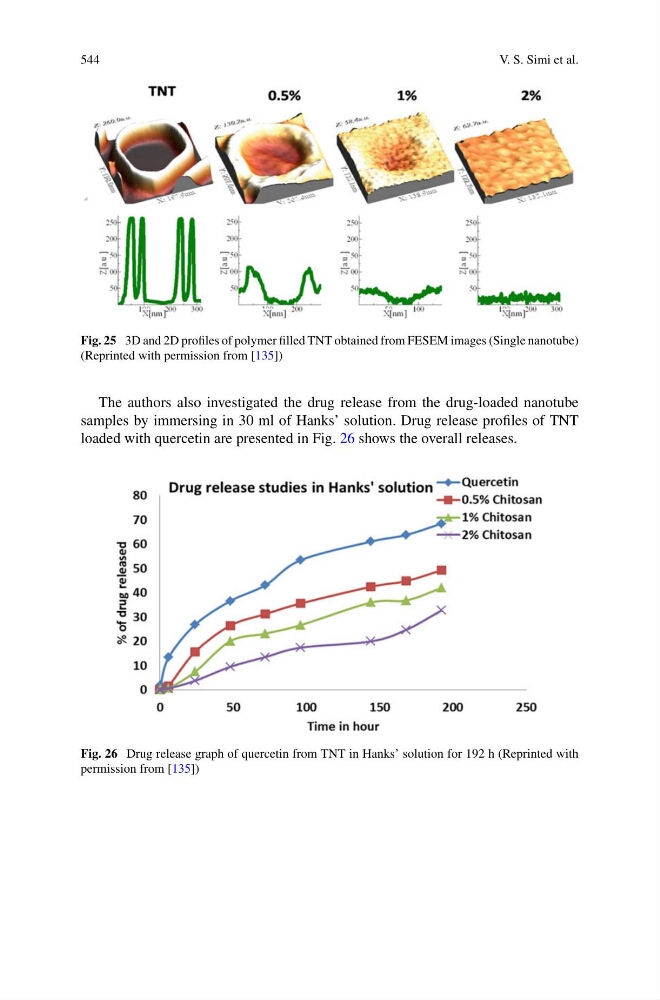
Fig. 25 3D and 2D profiles of polymer filled TNT obtained from FESEM images (Single nanotube)
(Reprinted with permission from [135])
The authors also investigated the drug release from the drug-loaded nanotube
samples by immersing in 30 ml of Hanks’ solution. Drug release profiles of TNT
loaded with quercetin are presented in Fig. 26 shows the overall releases.
Fig. 26 Drug release graph of quercetin from TNT in Hanks’ solution for 192 h (Reprinted with
permission from [135])
V. S. Simi et al.
Fig. 25 3D and 2D profiles of polymer filled TNT obtained from FESEM images (Single nanotube)
(Reprinted with permission from [135])
The authors also investigated the drug release from the drug-loaded nanotube
samples by immersing in 30 ml of Hanks’ solution. Drug release profiles of TNT
loaded with quercetin are presented in Fig. 26 shows the overall releases.
Fig. 26 Drug release graph of quercetin from TNT in Hanks’ solution for 192 h (Reprinted with
permission from [135])