

526
V. S. Simi et al.
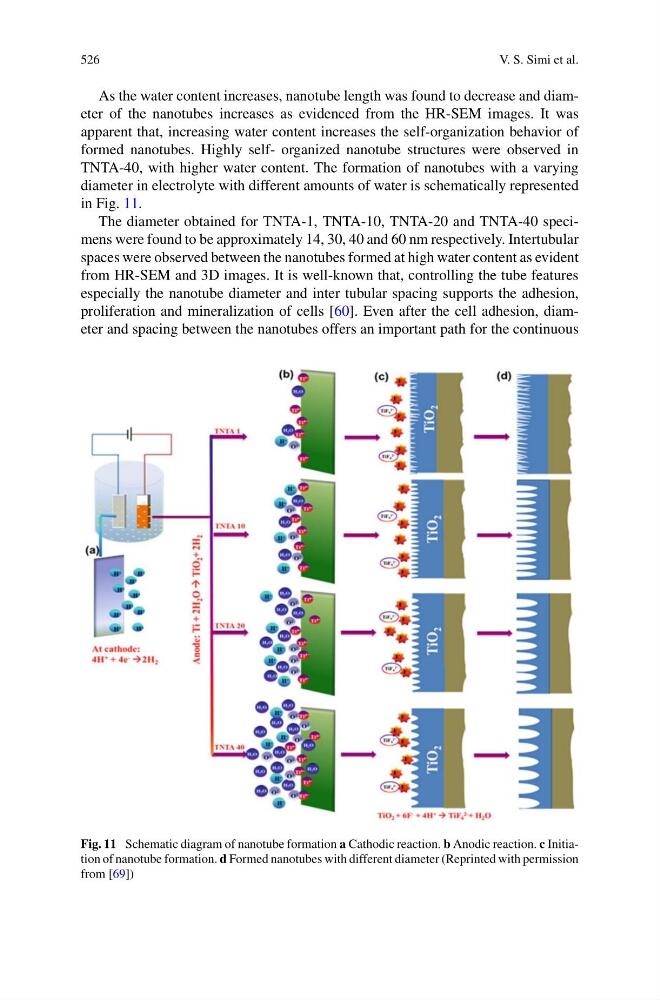
As the water content increases, nanotube length was found to decrease and diameter of the nanotubes increases as evidenced from the HR-SEM images. It was
apparent that, increasing water content increases the self-organization behavior of
formed nanotubes. Highly self- organized nanotube structures were observed in
TNTA-40, with higher water content. The formation of nanotubes with a varying
diameter in electrolyte with different amounts of water is schematically represented
in Fig. 11.
The diameter obtained for TNTA-1, TNTA-10, TNTA-20 and TNTA-40 specimens were found to be approximately 14, 30, 40 and 60 nm respectively. Intertubular
spaces were observed between the nanotubes formed at high water content as evident
from HR-SEM and 3D images. It is well-known that, controlling the tube features
especially the nanotube diameter and inter tubular spacing supports the adhesion,
proliferation and mineralization of cells [60]. Even after the cell adhesion, diameter and spacing between the nanotubes offers an important path for the continuous
Fig. 11 Schematic diagram of nanotube formation a Cathodic reaction. b Anodic reaction. c Initiation of nanotube formation. d Formed nanotubes with different diameter (Reprinted with permission
from [69])
V. S. Simi et al.
As the water content increases, nanotube length was found to decrease and diameter of the nanotubes increases as evidenced from the HR-SEM images. It was
apparent that, increasing water content increases the self-organization behavior of
formed nanotubes. Highly self- organized nanotube structures were observed in
TNTA-40, with higher water content. The formation of nanotubes with a varying
diameter in electrolyte with different amounts of water is schematically represented
in Fig. 11.
The diameter obtained for TNTA-1, TNTA-10, TNTA-20 and TNTA-40 specimens were found to be approximately 14, 30, 40 and 60 nm respectively. Intertubular
spaces were observed between the nanotubes formed at high water content as evident
from HR-SEM and 3D images. It is well-known that, controlling the tube features
especially the nanotube diameter and inter tubular spacing supports the adhesion,
proliferation and mineralization of cells [60]. Even after the cell adhesion, diameter and spacing between the nanotubes offers an important path for the continuous
Fig. 11 Schematic diagram of nanotube formation a Cathodic reaction. b Anodic reaction. c Initiation of nanotube formation. d Formed nanotubes with different diameter (Reprinted with permission
from [69])