

10.9 Quantum Control
391
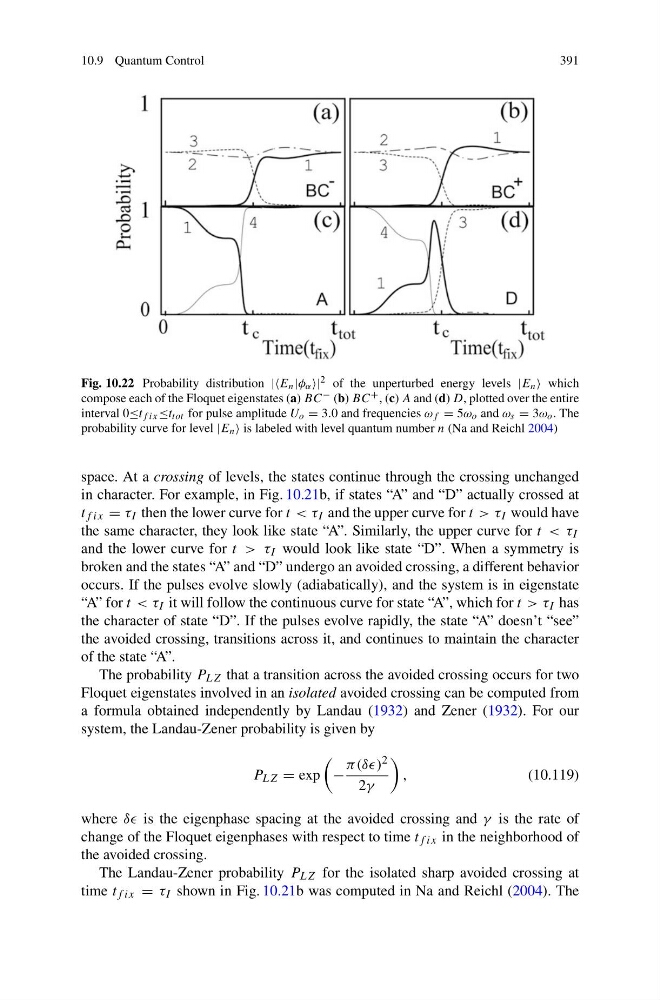
Fig. 10.22 Probability distribution ||E n |φ α 2 of the unperturbed energy levels |E n which
compose each of the Floquet eigenstates (a) BC − (b) BC + , (c) A and (d) D, plotted over the entire
interval 0≤t f ix ≤t tot for pulse amplitude U o = 3.0 and frequencies ω f = 5ω o and ω s = 3ω o . The
probability curve for level |E n is labeled with level quantum number n (Na and Reichl 2004)
space. At a crossing of levels, the states continue through the crossing unchanged
in character. For example, in Fig. 10.21b, if states “A” and “D” actually crossed at
t f ix = τ I then the lower curve for t < τ I and the upper curve for t > τ I would have
the same character, they look like state “A”. Similarly, the upper curve for t < τ I
and the lower curve for t > τ I would look like state “D”. When a symmetry is
broken and the states “A” and “D” undergo an avoided crossing, a different behavior
occurs. If the pulses evolve slowly (adiabatically), and the system is in eigenstate
“A” for t < τ I it will follow the continuous curve for state “A”, which for t > τ I has
the character of state “D”. If the pulses evolve rapidly, the state “A” doesn’t “see”
the avoided crossing, transitions across it, and continues to maintain the character
of the state “A”.
The probability P LZ that a transition across the avoided crossing occurs for two
Floquet eigenstates involved in an isolated avoided crossing can be computed from
a formula obtained independently by Landau (1932) and Zener (1932). For our
system, the Landau-Zener probability is given by
P LZ = exp
−
π(δδ) 2
2γ
,
(10.119)
where δδ is the eigenphase spacing at the avoided crossing and γ is the rate of
change of the Floquet eigenphases with respect to time t f ix in the neighborhood of
the avoided crossing.
The Landau-Zener probability P LZ for the isolated sharp avoided crossing at
time t f ix = τ I shown in Fig. 10.21b was computed in Na and Reichl (2004). The
391
Fig. 10.22 Probability distribution ||E n |φ α 2 of the unperturbed energy levels |E n which
compose each of the Floquet eigenstates (a) BC − (b) BC + , (c) A and (d) D, plotted over the entire
interval 0≤t f ix ≤t tot for pulse amplitude U o = 3.0 and frequencies ω f = 5ω o and ω s = 3ω o . The
probability curve for level |E n is labeled with level quantum number n (Na and Reichl 2004)
space. At a crossing of levels, the states continue through the crossing unchanged
in character. For example, in Fig. 10.21b, if states “A” and “D” actually crossed at
t f ix = τ I then the lower curve for t < τ I and the upper curve for t > τ I would have
the same character, they look like state “A”. Similarly, the upper curve for t < τ I
and the lower curve for t > τ I would look like state “D”. When a symmetry is
broken and the states “A” and “D” undergo an avoided crossing, a different behavior
occurs. If the pulses evolve slowly (adiabatically), and the system is in eigenstate
“A” for t < τ I it will follow the continuous curve for state “A”, which for t > τ I has
the character of state “D”. If the pulses evolve rapidly, the state “A” doesn’t “see”
the avoided crossing, transitions across it, and continues to maintain the character
of the state “A”.
The probability P LZ that a transition across the avoided crossing occurs for two
Floquet eigenstates involved in an isolated avoided crossing can be computed from
a formula obtained independently by Landau (1932) and Zener (1932). For our
system, the Landau-Zener probability is given by
P LZ = exp
−
π(δδ) 2
2γ
,
(10.119)
where δδ is the eigenphase spacing at the avoided crossing and γ is the rate of
change of the Floquet eigenphases with respect to time t f ix in the neighborhood of
the avoided crossing.
The Landau-Zener probability P LZ for the isolated sharp avoided crossing at
time t f ix = τ I shown in Fig. 10.21b was computed in Na and Reichl (2004). The