

10.5 Dynamical Tunneling in Atom Optics Experiments
361
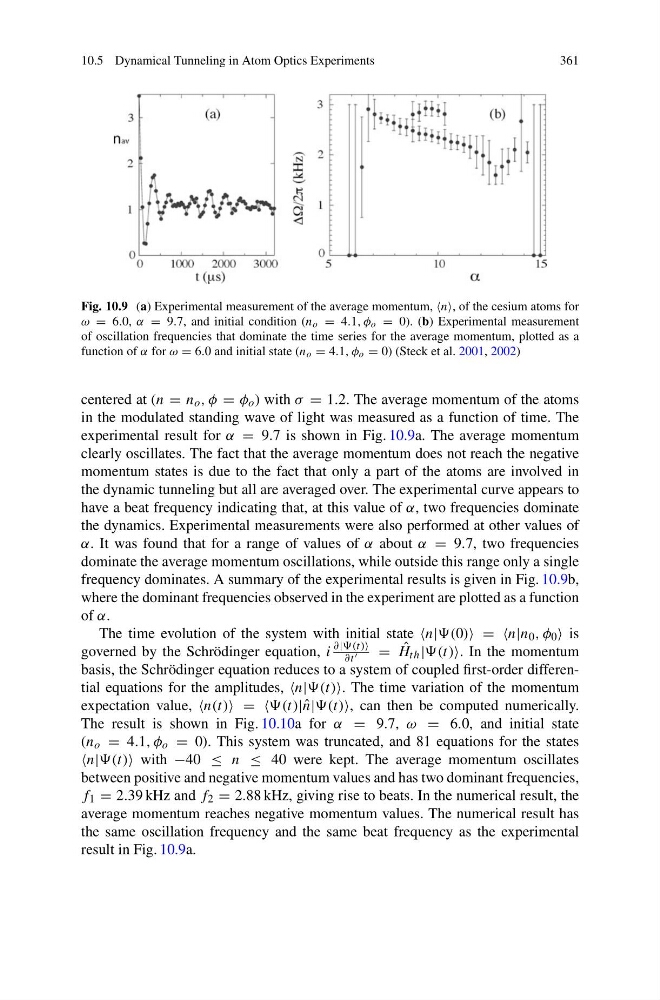
Fig. 10.9 (a) Experimental measurement of the average momentum, of the cesium atoms for
ω = 6.0, α = 9.7, and initial condition (n o = 4.1, φ o = 0). (b) Experimental measurement
of oscillation frequencies that dominate the time series for the average momentum, plotted as a
function of α for ω = 6.0 and initial state (n o = 4.1, φ o = 0) (Steck et al. 2001, 2002)
centered at (n = n o , φ = φ o ) with σ = 1.2. The average momentum of the atoms
in the modulated standing wave of light was measured as a function of time. The
experimental result for α = 9.7 is shown in Fig. 10.9a. The average momentum
clearly oscillates. The fact that the average momentum does not reach the negative
momentum states is due to the fact that only a part of the atoms are involved in
the dynamic tunneling but all are averaged over. The experimental curve appears to
have a beat frequency indicating that, at this value of α, two frequencies dominate
the dynamics. Experimental measurements were also performed at other values of
α. It was found that for a range of values of α about α = 9.7, two frequencies
dominate the average momentum oscillations, while outside this range only a single
frequency dominates. A summary of the experimental results is given in Fig. 10.9b,
where the dominant frequencies observed in the experiment are plotted as a function
of α.
The time evolution of the system with initial state = =n|n 0 , φ 0 is
governed by the Schrödinger equation, i
∂|
∂t
= ˆ
H th | In the momentum
basis, the Schrödinger equation reduces to a system of coupled first-order differential equations for the amplitudes, The time variation of the momentum
expectation value, n(t) = =(t)| ˆ
n| can then be computed numerically.
The result is shown in Fig. 10.10a for α = 9.7, ω = 6.0, and initial state
(n o = 4.1, φ o = 0). This system was truncated, and 81 equations for the states
with −40 ≤ n ≤ 40 were kept. The average momentum oscillates
between positive and negative momentum values and has two dominant frequencies,
f 1 = 2.39 kHz and f 2 = 2.88 kHz, giving rise to beats. In the numerical result, the
average momentum reaches negative momentum values. The numerical result has
the same oscillation frequency and the same beat frequency as the experimental
result in Fig. 10.9a.
361
Fig. 10.9 (a) Experimental measurement of the average momentum, of the cesium atoms for
ω = 6.0, α = 9.7, and initial condition (n o = 4.1, φ o = 0). (b) Experimental measurement
of oscillation frequencies that dominate the time series for the average momentum, plotted as a
function of α for ω = 6.0 and initial state (n o = 4.1, φ o = 0) (Steck et al. 2001, 2002)
centered at (n = n o , φ = φ o ) with σ = 1.2. The average momentum of the atoms
in the modulated standing wave of light was measured as a function of time. The
experimental result for α = 9.7 is shown in Fig. 10.9a. The average momentum
clearly oscillates. The fact that the average momentum does not reach the negative
momentum states is due to the fact that only a part of the atoms are involved in
the dynamic tunneling but all are averaged over. The experimental curve appears to
have a beat frequency indicating that, at this value of α, two frequencies dominate
the dynamics. Experimental measurements were also performed at other values of
α. It was found that for a range of values of α about α = 9.7, two frequencies
dominate the average momentum oscillations, while outside this range only a single
frequency dominates. A summary of the experimental results is given in Fig. 10.9b,
where the dominant frequencies observed in the experiment are plotted as a function
of α.
The time evolution of the system with initial state = =n|n 0 , φ 0 is
governed by the Schrödinger equation, i
∂|
∂t
= ˆ
H th | In the momentum
basis, the Schrödinger equation reduces to a system of coupled first-order differential equations for the amplitudes, The time variation of the momentum
expectation value, n(t) = =(t)| ˆ
n| can then be computed numerically.
The result is shown in Fig. 10.10a for α = 9.7, ω = 6.0, and initial state
(n o = 4.1, φ o = 0). This system was truncated, and 81 equations for the states
with −40 ≤ n ≤ 40 were kept. The average momentum oscillates
between positive and negative momentum values and has two dominant frequencies,
f 1 = 2.39 kHz and f 2 = 2.88 kHz, giving rise to beats. In the numerical result, the
average momentum reaches negative momentum values. The numerical result has
the same oscillation frequency and the same beat frequency as the experimental
result in Fig. 10.9a.