

10.4 Dynamics of a Driven Bounded Particle
355
80
n =1
U n,n (T 0 ) n | α = e
−ii α T 0 n | α
(10.35)
where α is the αth Floquet eigenphase (quasienergy), and | α = | α (0) =
| α (T 0 ) is the αth Floquet eigenstate. The Floquet eigenvalues are defined modulo
ω 0 =
2π
T 0
.
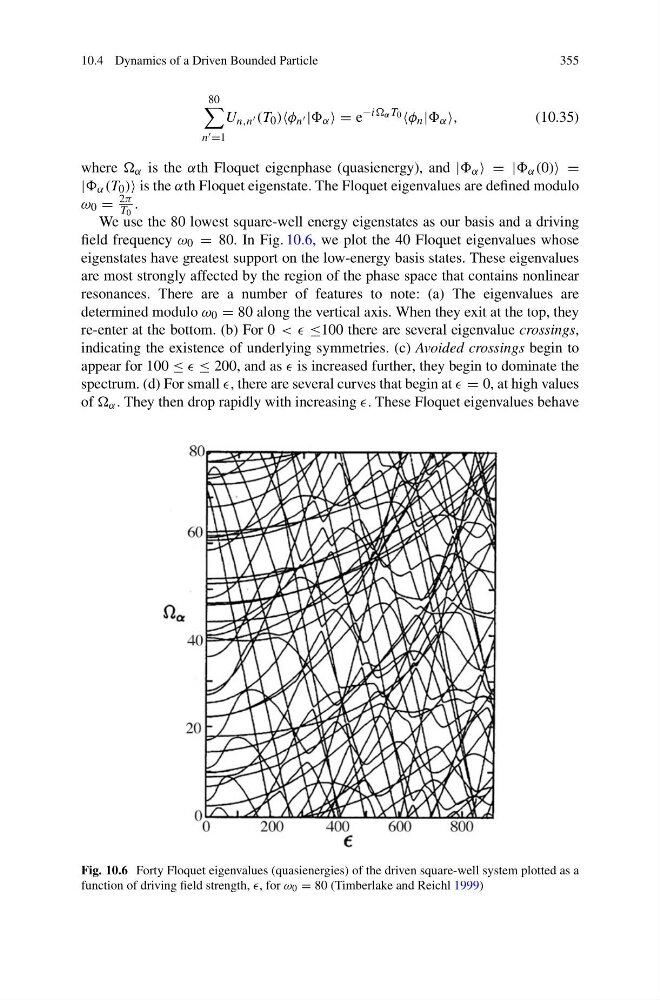
We use the 80 lowest square-well energy eigenstates as our basis and a driving
field frequency ω 0 = 80. In Fig. 10.6, we plot the 40 Floquet eigenvalues whose
eigenstates have greatest support on the low-energy basis states. These eigenvalues
are most strongly affected by the region of the phase space that contains nonlinear
resonances. There are a number of features to note: (a) The eigenvalues are
determined modulo ω 0 = 80 along the vertical axis. When they exit at the top, they
re-enter at the bottom. (b) For 0 < < ≤100 there are several eigenvalue crossings,
indicating the existence of underlying symmetries. (c) Avoided crossings begin to
appear for 100 ≤ ≤ 200, and as is increased further, they begin to dominate the
spectrum. (d) For small , there are several curves that begin at = 0, at high values
of α . They then drop rapidly with increasing . These Floquet eigenvalues behave
Fig. 10.6 Forty Floquet eigenvalues (quasienergies) of the driven square-well system plotted as a
function of driving field strength, , for ω 0 = 80 (Timberlake and Reichl 1999)
355
80
n =1
U n,n (T 0 ) n | α = e
−ii α T 0 n | α
(10.35)
where α is the αth Floquet eigenphase (quasienergy), and | α = | α (0) =
| α (T 0 ) is the αth Floquet eigenstate. The Floquet eigenvalues are defined modulo
ω 0 =
2π
T 0
.
We use the 80 lowest square-well energy eigenstates as our basis and a driving
field frequency ω 0 = 80. In Fig. 10.6, we plot the 40 Floquet eigenvalues whose
eigenstates have greatest support on the low-energy basis states. These eigenvalues
are most strongly affected by the region of the phase space that contains nonlinear
resonances. There are a number of features to note: (a) The eigenvalues are
determined modulo ω 0 = 80 along the vertical axis. When they exit at the top, they
re-enter at the bottom. (b) For 0 < < ≤100 there are several eigenvalue crossings,
indicating the existence of underlying symmetries. (c) Avoided crossings begin to
appear for 100 ≤ ≤ 200, and as is increased further, they begin to dominate the
spectrum. (d) For small , there are several curves that begin at = 0, at high values
of α . They then drop rapidly with increasing . These Floquet eigenvalues behave
Fig. 10.6 Forty Floquet eigenvalues (quasienergies) of the driven square-well system plotted as a
function of driving field strength, , for ω 0 = 80 (Timberlake and Reichl 1999)