

7.7 Quantum Spin Models
225
Table 7.2 Character table
for the group D 2 ⊗ S 2
(Atkins et al. 1970)
D 2 ⊗ S 2 I R x R y R z P
R x P R y P R z P
A1S
1
1
1
1
1
1
1
1
A1A
1
1
1
1 −1 −1
−1
−1
B1S
1
1 −1 −1
1
1
−1
−1
B1A
1
1 −1 −1 −1 −1
1
1
B2S
1 −1
1 −1
1 −1
1
−1
B2A
1 −1
1 −1 −1
1
−1
1
B3S
1 −1 −1
1
1 −1
−1
1
B3A
1 −1 −1
1 −1
1
1
−1
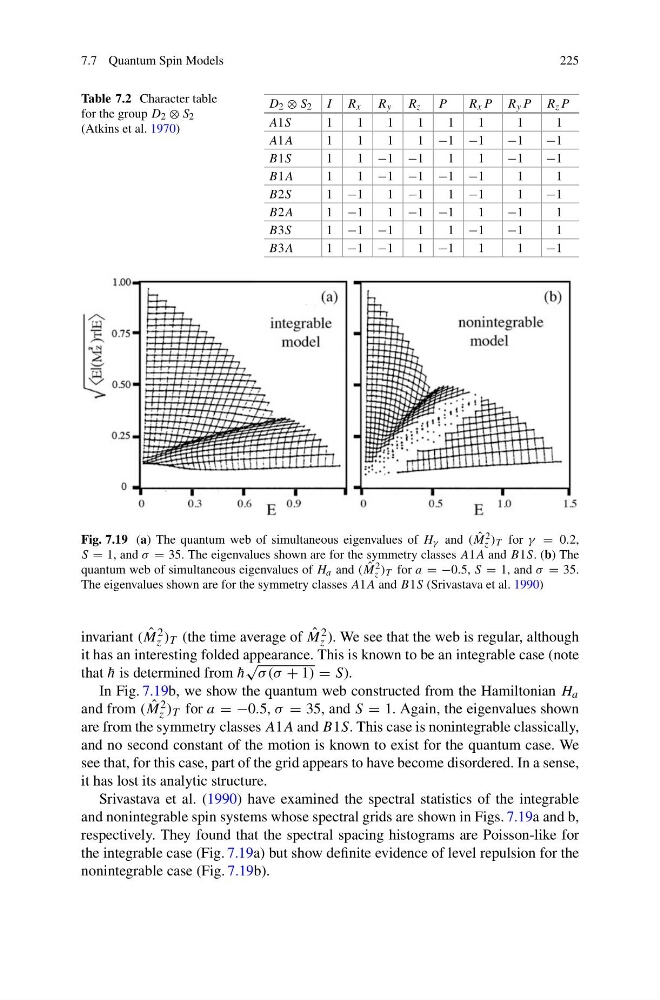
Fig. 7.19 (a) The quantum web of simultaneous eigenvalues of H γ and ( ˆ
M 2
z ) T for γ = 0.2,
S = 1, and σ = 35. The eigenvalues shown are for the symmetry classes A1A and B1S. (b) The
quantum web of simultaneous eigenvalues of H a and ( ˆ
M 2
z ) T for a = −0.5, S = 1, and σ = 35.
The eigenvalues shown are for the symmetry classes A1A and B1S (Srivastava et al. 1990)
invariant ( ˆ
M 2
z ) T (the time average of ˆ
M 2
z ). We see that the web is regular, although
it has an interesting folded appearance. This is known to be an integrable case (note
that ¯
h is determined from ¯
h
√
σ (σ + 1) = S).
In Fig. 7.19b, we show the quantum web constructed from the Hamiltonian H a
and from ( ˆ
M 2
z ) T for a = −0.5, σ = 35, and S = 1. Again, the eigenvalues shown
are from the symmetry classes A1A and B1S. This case is nonintegrable classically,
and no second constant of the motion is known to exist for the quantum case. We
see that, for this case, part of the grid appears to have become disordered. In a sense,
it has lost its analytic structure.
Srivastava et al. (1990) have examined the spectral statistics of the integrable
and nonintegrable spin systems whose spectral grids are shown in Figs. 7.19a and b,
respectively. They found that the spectral spacing histograms are Poisson-like for
the integrable case (Fig. 7.19a) but show definite evidence of level repulsion for the
nonintegrable case (Fig. 7.19b).
225
Table 7.2 Character table
for the group D 2 ⊗ S 2
(Atkins et al. 1970)
D 2 ⊗ S 2 I R x R y R z P
R x P R y P R z P
A1S
1
1
1
1
1
1
1
1
A1A
1
1
1
1 −1 −1
−1
−1
B1S
1
1 −1 −1
1
1
−1
−1
B1A
1
1 −1 −1 −1 −1
1
1
B2S
1 −1
1 −1
1 −1
1
−1
B2A
1 −1
1 −1 −1
1
−1
1
B3S
1 −1 −1
1
1 −1
−1
1
B3A
1 −1 −1
1 −1
1
1
−1
Fig. 7.19 (a) The quantum web of simultaneous eigenvalues of H γ and ( ˆ
M 2
z ) T for γ = 0.2,
S = 1, and σ = 35. The eigenvalues shown are for the symmetry classes A1A and B1S. (b) The
quantum web of simultaneous eigenvalues of H a and ( ˆ
M 2
z ) T for a = −0.5, S = 1, and σ = 35.
The eigenvalues shown are for the symmetry classes A1A and B1S (Srivastava et al. 1990)
invariant ( ˆ
M 2
z ) T (the time average of ˆ
M 2
z ). We see that the web is regular, although
it has an interesting folded appearance. This is known to be an integrable case (note
that ¯
h is determined from ¯
h
√
σ (σ + 1) = S).
In Fig. 7.19b, we show the quantum web constructed from the Hamiltonian H a
and from ( ˆ
M 2
z ) T for a = −0.5, σ = 35, and S = 1. Again, the eigenvalues shown
are from the symmetry classes A1A and B1S. This case is nonintegrable classically,
and no second constant of the motion is known to exist for the quantum case. We
see that, for this case, part of the grid appears to have become disordered. In a sense,
it has lost its analytic structure.
Srivastava et al. (1990) have examined the spectral statistics of the integrable
and nonintegrable spin systems whose spectral grids are shown in Figs. 7.19a and b,
respectively. They found that the spectral spacing histograms are Poisson-like for
the integrable case (Fig. 7.19a) but show definite evidence of level repulsion for the
nonintegrable case (Fig. 7.19b).