

1. Measures to be implemented to the residential emission:
2. Connection of individually heated houses to the municipal heating network:
This measure is proposed for 4 districts, covering approximately 1 % of the
agglomeration area, with approximately 13,000 inhabitants.
3. Measures to be implemented to the road transport emission: Improvement of
public transport network by building of 2 ring roads: City Centre Ring Road &
City Ring Road (up to 2020) and establishment of a low emission zone in the
City Centre.
Implementation of the first measure alone will reduce total PM10 emission in the
zone by as much as 21 %, while implementation of the second will reduce total
PM10 and NO 2 emissions in the zone by 30 and 53 %, respectively.
For each of proposed measures differences in concentration were calculated
(scenario analyses).
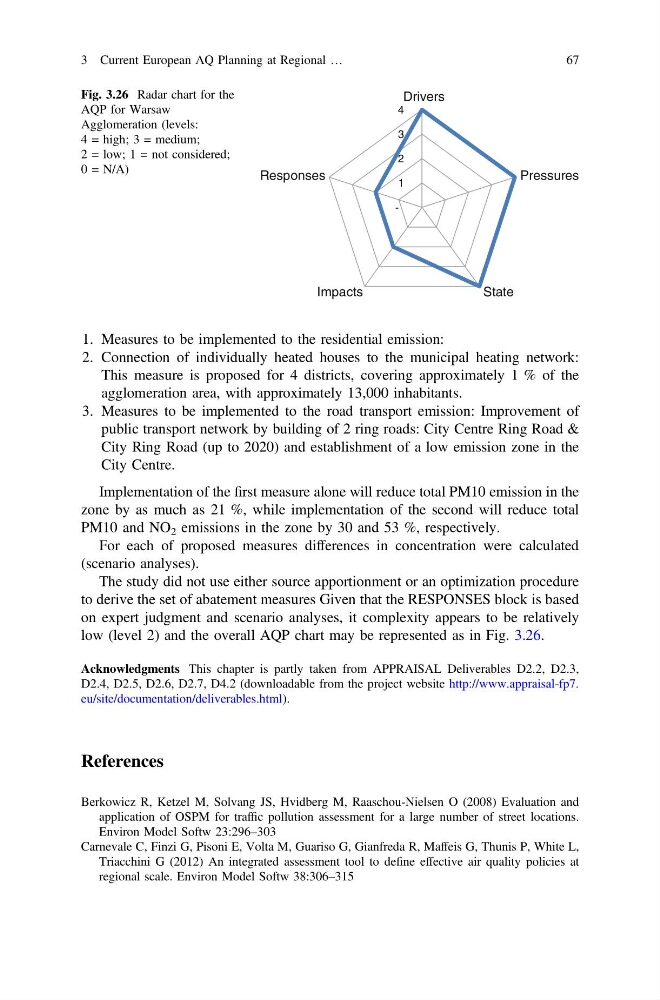
The study did not use either source apportionment or an optimization procedure
to derive the set of abatement measures Given that the RESPONSES block is based
on expert judgment and scenario analyses, it complexity appears to be relatively
low (level 2) and the overall AQP chart may be represented as in Fig. 3.26.
Acknowledgments This chapter is partly taken from APPRAISAL Deliverables D2.2, D2.3,
D2.4, D2.5, D2.6, D2.7, D4.2 (downloadable from the project website http://www.appraisal-fp7.
eu/site/documentation/deliverables.html).
References
Berkowicz R, Ketzel M, Solvang JS, Hvidberg M, Raaschou-Nielsen O (2008) Evaluation and
application of OSPM for traffic pollution assessment for a large number of street locations.
Environ Model Softw 23:296–303
Carnevale C, Finzi G, Pisoni E, Volta M, Guariso G, Gianfreda R, Maffeis G, Thunis P, White L,
Triacchini G (2012) An integrated assessment tool to define effective air quality policies at
regional scale. Environ Model Softw 38:306–315
-
1
2
3
4
Drivers
Pressures
State
Impacts
Responses
Fig. 3.26 Radar chart for the
AQP for Warsaw
Agglomeration (levels:
4 = high; 3 = medium;
2 = low; 1 = not considered;
0 = N/A)
3 Current European AQ Planning at Regional …
67
2. Connection of individually heated houses to the municipal heating network:
This measure is proposed for 4 districts, covering approximately 1 % of the
agglomeration area, with approximately 13,000 inhabitants.
3. Measures to be implemented to the road transport emission: Improvement of
public transport network by building of 2 ring roads: City Centre Ring Road &
City Ring Road (up to 2020) and establishment of a low emission zone in the
City Centre.
Implementation of the first measure alone will reduce total PM10 emission in the
zone by as much as 21 %, while implementation of the second will reduce total
PM10 and NO 2 emissions in the zone by 30 and 53 %, respectively.
For each of proposed measures differences in concentration were calculated
(scenario analyses).
The study did not use either source apportionment or an optimization procedure
to derive the set of abatement measures Given that the RESPONSES block is based
on expert judgment and scenario analyses, it complexity appears to be relatively
low (level 2) and the overall AQP chart may be represented as in Fig. 3.26.
Acknowledgments This chapter is partly taken from APPRAISAL Deliverables D2.2, D2.3,
D2.4, D2.5, D2.6, D2.7, D4.2 (downloadable from the project website http://www.appraisal-fp7.
eu/site/documentation/deliverables.html).
References
Berkowicz R, Ketzel M, Solvang JS, Hvidberg M, Raaschou-Nielsen O (2008) Evaluation and
application of OSPM for traffic pollution assessment for a large number of street locations.
Environ Model Softw 23:296–303
Carnevale C, Finzi G, Pisoni E, Volta M, Guariso G, Gianfreda R, Maffeis G, Thunis P, White L,
Triacchini G (2012) An integrated assessment tool to define effective air quality policies at
regional scale. Environ Model Softw 38:306–315
-
1
2
3
4
Drivers
Pressures
State
Impacts
Responses
Fig. 3.26 Radar chart for the
AQP for Warsaw
Agglomeration (levels:
4 = high; 3 = medium;
2 = low; 1 = not considered;
0 = N/A)
3 Current European AQ Planning at Regional …
67