

3.3.3 AQP for the Warsaw Agglomeration
Description of the AQP
Warsaw has about 1.7 million inhabitants and is the largest and one of the most
congested cities in Poland. This is mainly due to the lack of a real bypass road, so
most of the traffic is routed through city streets, which are quite narrow in many
areas. The Warsaw metro is one of the newest subway systems in Europe, however
it has only one line so far. Building activities for the second line—which is being
currently realized—constitutes an additional disruption in city traffic. In general,
bicycle routes are scarce, being well organized only in a few districts. As a result,
according to the latest assessment (Deloitte 2014) each Warsaw’s dweller loses on
average a month of salary a year, due to time spent in traffic congestion.
The first Air Quality Plan for Warsaw was issued due to the exceedances of PM10
and NO 2 limit values in 2004. The road transport sector (SNAP07) has the biggest
share in all pollutants concentrations, but there are a few districts with a significant
share of residential heating. In general, the contribution of transport emissions to
PM concentrations is constantly growing. Beyond the exceedance zones, the pollutants inflow from outside of the agglomeration has an important share, at times
being the prevailing one.
This AQP study was performed for the years 2004–2007. Furthermore, plans
concerning B(a)P (2007) and PM2.5 (2010) were also established. Warsaw
agglomeration zone is considered as a hot spot with problems in terms of exceedances of the NO 2 and PM guidelines of the EC Directive. A new AQP is currently
being implemented (up to the end of 2016).
Drivers/Pressures
The Air Quality Plan (AQP) for Warsaw takes into account national, regional and
local strategies and applies bottom-up approach, therefore the complexity of the
DRIVERS block is high (level 4). The main local activities are: road transport,
residential heating, energy production and industry.
-
1
2
3
4
Drivers
Pressures
State
Impacts
Responses
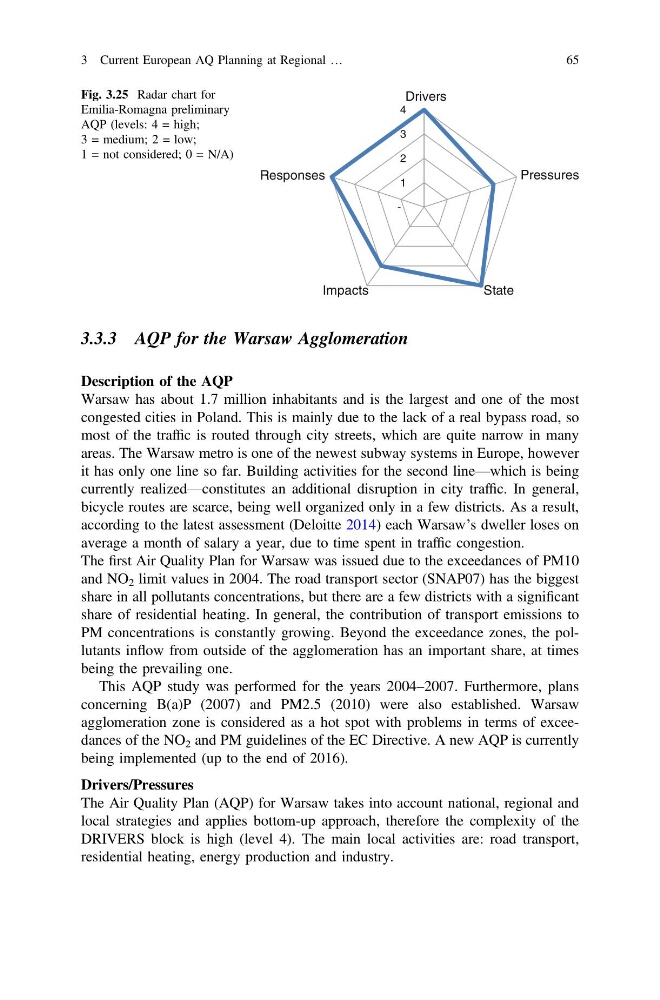
Fig. 3.25 Radar chart for
Emilia-Romagna preliminary
AQP (levels: 4 = high;
3 = medium; 2 = low;
1 = not considered; 0 = N/A)
3 Current European AQ Planning at Regional …
65
Description of the AQP
Warsaw has about 1.7 million inhabitants and is the largest and one of the most
congested cities in Poland. This is mainly due to the lack of a real bypass road, so
most of the traffic is routed through city streets, which are quite narrow in many
areas. The Warsaw metro is one of the newest subway systems in Europe, however
it has only one line so far. Building activities for the second line—which is being
currently realized—constitutes an additional disruption in city traffic. In general,
bicycle routes are scarce, being well organized only in a few districts. As a result,
according to the latest assessment (Deloitte 2014) each Warsaw’s dweller loses on
average a month of salary a year, due to time spent in traffic congestion.
The first Air Quality Plan for Warsaw was issued due to the exceedances of PM10
and NO 2 limit values in 2004. The road transport sector (SNAP07) has the biggest
share in all pollutants concentrations, but there are a few districts with a significant
share of residential heating. In general, the contribution of transport emissions to
PM concentrations is constantly growing. Beyond the exceedance zones, the pollutants inflow from outside of the agglomeration has an important share, at times
being the prevailing one.
This AQP study was performed for the years 2004–2007. Furthermore, plans
concerning B(a)P (2007) and PM2.5 (2010) were also established. Warsaw
agglomeration zone is considered as a hot spot with problems in terms of exceedances of the NO 2 and PM guidelines of the EC Directive. A new AQP is currently
being implemented (up to the end of 2016).
Drivers/Pressures
The Air Quality Plan (AQP) for Warsaw takes into account national, regional and
local strategies and applies bottom-up approach, therefore the complexity of the
DRIVERS block is high (level 4). The main local activities are: road transport,
residential heating, energy production and industry.
-
1
2
3
4
Drivers
Pressures
State
Impacts
Responses
Fig. 3.25 Radar chart for
Emilia-Romagna preliminary
AQP (levels: 4 = high;
3 = medium; 2 = low;
1 = not considered; 0 = N/A)
3 Current European AQ Planning at Regional …
65