

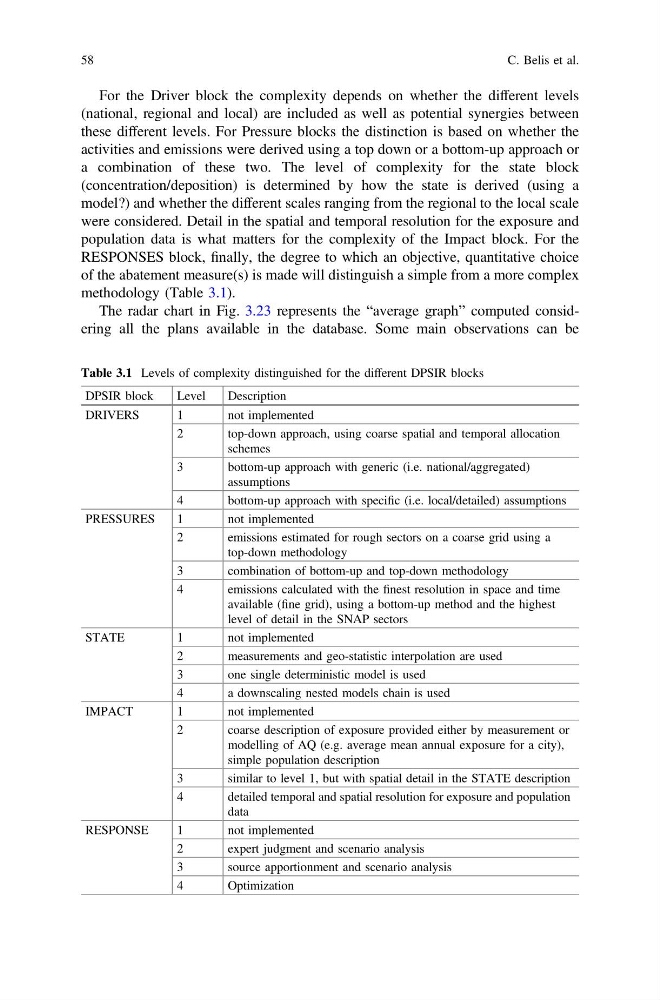
For the Driver block the complexity depends on whether the different levels
(national, regional and local) are included as well as potential synergies between
these different levels. For Pressure blocks the distinction is based on whether the
activities and emissions were derived using a top down or a bottom-up approach or
a combination of these two. The level of complexity for the state block
(concentration/deposition) is determined by how the state is derived (using a
model?) and whether the different scales ranging from the regional to the local scale
were considered. Detail in the spatial and temporal resolution for the exposure and
population data is what matters for the complexity of the Impact block. For the
RESPONSES block, finally, the degree to which an objective, quantitative choice
of the abatement measure(s) is made will distinguish a simple from a more complex
methodology (Table 3.1).
The radar chart in Fig. 3.23 represents the “average graph” computed considering all the plans available in the database. Some main observations can be
Table 3.1 Levels of complexity distinguished for the different DPSIR blocks
DPSIR block
Level
Description
DRIVERS
1
not implemented
2
top-down approach, using coarse spatial and temporal allocation
schemes
3
bottom-up approach with generic (i.e. national/aggregated)
assumptions
4
bottom-up approach with specific (i.e. local/detailed) assumptions
PRESSURES
1
not implemented
2
emissions estimated for rough sectors on a coarse grid using a
top-down methodology
3
combination of bottom-up and top-down methodology
4
emissions calculated with the finest resolution in space and time
available (fine grid), using a bottom-up method and the highest
level of detail in the SNAP sectors
STATE
1
not implemented
2
measurements and geo-statistic interpolation are used
3
one single deterministic model is used
4
a downscaling nested models chain is used
IMPACT
1
not implemented
2
coarse description of exposure provided either by measurement or
modelling of AQ (e.g. average mean annual exposure for a city),
simple population description
3
similar to level 1, but with spatial detail in the STATE description
4
detailed temporal and spatial resolution for exposure and population
data
RESPONSE
1
not implemented
2
expert judgment and scenario analysis
3
source apportionment and scenario analysis
4
Optimization
58
C. Belis et al.
(national, regional and local) are included as well as potential synergies between
these different levels. For Pressure blocks the distinction is based on whether the
activities and emissions were derived using a top down or a bottom-up approach or
a combination of these two. The level of complexity for the state block
(concentration/deposition) is determined by how the state is derived (using a
model?) and whether the different scales ranging from the regional to the local scale
were considered. Detail in the spatial and temporal resolution for the exposure and
population data is what matters for the complexity of the Impact block. For the
RESPONSES block, finally, the degree to which an objective, quantitative choice
of the abatement measure(s) is made will distinguish a simple from a more complex
methodology (Table 3.1).
The radar chart in Fig. 3.23 represents the “average graph” computed considering all the plans available in the database. Some main observations can be
Table 3.1 Levels of complexity distinguished for the different DPSIR blocks
DPSIR block
Level
Description
DRIVERS
1
not implemented
2
top-down approach, using coarse spatial and temporal allocation
schemes
3
bottom-up approach with generic (i.e. national/aggregated)
assumptions
4
bottom-up approach with specific (i.e. local/detailed) assumptions
PRESSURES
1
not implemented
2
emissions estimated for rough sectors on a coarse grid using a
top-down methodology
3
combination of bottom-up and top-down methodology
4
emissions calculated with the finest resolution in space and time
available (fine grid), using a bottom-up method and the highest
level of detail in the SNAP sectors
STATE
1
not implemented
2
measurements and geo-statistic interpolation are used
3
one single deterministic model is used
4
a downscaling nested models chain is used
IMPACT
1
not implemented
2
coarse description of exposure provided either by measurement or
modelling of AQ (e.g. average mean annual exposure for a city),
simple population description
3
similar to level 1, but with spatial detail in the STATE description
4
detailed temporal and spatial resolution for exposure and population
data
RESPONSE
1
not implemented
2
expert judgment and scenario analysis
3
source apportionment and scenario analysis
4
Optimization
58
C. Belis et al.