

Approximately 20 % of the AQPs that undertook a HIA considered a sub-group
based on the age of the population. RPs also focused on the sub-groups gender and
on other variables, beside age.
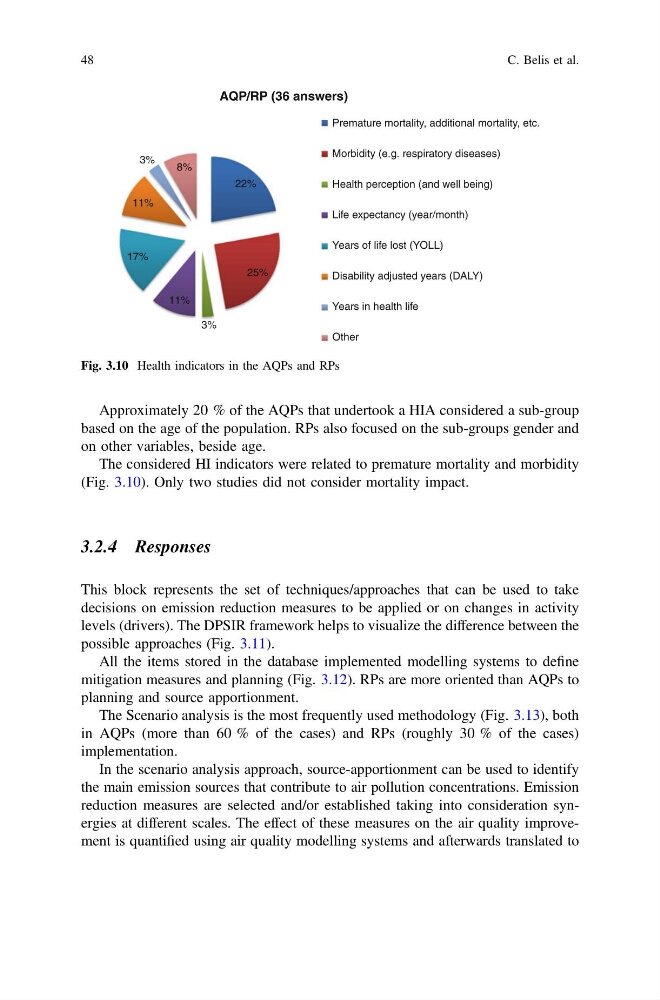
The considered HI indicators were related to premature mortality and morbidity
(Fig. 3.10). Only two studies did not consider mortality impact.
3.2.4 Responses
This block represents the set of techniques/approaches that can be used to take
decisions on emission reduction measures to be applied or on changes in activity
levels (drivers). The DPSIR framework helps to visualize the difference between the
possible approaches (Fig. 3.11).
All the items stored in the database implemented modelling systems to define
mitigation measures and planning (Fig. 3.12). RPs are more oriented than AQPs to
planning and source apportionment.
The Scenario analysis is the most frequently used methodology (Fig. 3.13), both
in AQPs (more than 60 % of the cases) and RPs (roughly 30 % of the cases)
implementation.
In the scenario analysis approach, source-apportionment can be used to identify
the main emission sources that contribute to air pollution concentrations. Emission
reduction measures are selected and/or established taking into consideration synergies at different scales. The effect of these measures on the air quality improvement is quantified using air quality modelling systems and afterwards translated to
22%
25%
3%
11%
17%
11%
3%
8%
AQP/RP (36 answers)
Premature mortality, additional mortality, etc.
Morbidity (e.g. respiratory diseases)
Health perception (and well being)
Life expectancy (year/month)
Years of life lost (YOLL)
Disability adjusted years (DALY)
Years in health life
Other
Fig. 3.10 Health indicators in the AQPs and RPs
48
C. Belis et al.
based on the age of the population. RPs also focused on the sub-groups gender and
on other variables, beside age.
The considered HI indicators were related to premature mortality and morbidity
(Fig. 3.10). Only two studies did not consider mortality impact.
3.2.4 Responses
This block represents the set of techniques/approaches that can be used to take
decisions on emission reduction measures to be applied or on changes in activity
levels (drivers). The DPSIR framework helps to visualize the difference between the
possible approaches (Fig. 3.11).
All the items stored in the database implemented modelling systems to define
mitigation measures and planning (Fig. 3.12). RPs are more oriented than AQPs to
planning and source apportionment.
The Scenario analysis is the most frequently used methodology (Fig. 3.13), both
in AQPs (more than 60 % of the cases) and RPs (roughly 30 % of the cases)
implementation.
In the scenario analysis approach, source-apportionment can be used to identify
the main emission sources that contribute to air pollution concentrations. Emission
reduction measures are selected and/or established taking into consideration synergies at different scales. The effect of these measures on the air quality improvement is quantified using air quality modelling systems and afterwards translated to
22%
25%
3%
11%
17%
11%
3%
8%
AQP/RP (36 answers)
Premature mortality, additional mortality, etc.
Morbidity (e.g. respiratory diseases)
Health perception (and well being)
Life expectancy (year/month)
Years of life lost (YOLL)
Disability adjusted years (DALY)
Years in health life
Other
Fig. 3.10 Health indicators in the AQPs and RPs
48
C. Belis et al.