

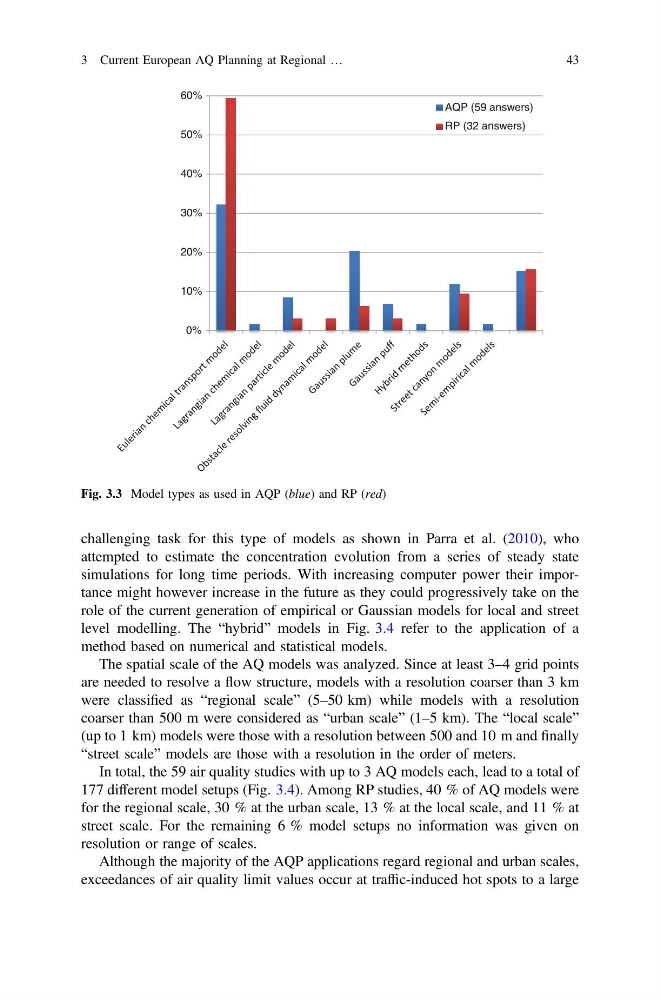
challenging task for this type of models as shown in Parra et al. (2010), who
attempted to estimate the concentration evolution from a series of steady state
simulations for long time periods. With increasing computer power their importance might however increase in the future as they could progressively take on the
role of the current generation of empirical or Gaussian models for local and street
level modelling. The “hybrid” models in Fig. 3.4 refer to the application of a
method based on numerical and statistical models.
The spatial scale of the AQ models was analyzed. Since at least 3–4 grid points
are needed to resolve a flow structure, models with a resolution coarser than 3 km
were classified as “regional scale” (5–50 km) while models with a resolution
coarser than 500 m were considered as “urban scale” (1–5 km). The “local scale”
(up to 1 km) models were those with a resolution between 500 and 10 m and finally
“street scale” models are those with a resolution in the order of meters.
In total, the 59 air quality studies with up to 3 AQ models each, lead to a total of
177 different model setups (Fig. 3.4). Among RP studies, 40 % of AQ models were
for the regional scale, 30 % at the urban scale, 13 % at the local scale, and 11 % at
street scale. For the remaining 6 % model setups no information was given on
resolution or range of scales.
Although the majority of the AQP applications regard regional and urban scales,
exceedances of air quality limit values occur at traffic-induced hot spots to a large
0%
10%
20%
30%
40%
50%
60%
AQP (59 answers)
RP (32 answers)
Fig. 3.3 Model types as used in AQP (blue) and RP (red)
3 Current European AQ Planning at Regional …
43
attempted to estimate the concentration evolution from a series of steady state
simulations for long time periods. With increasing computer power their importance might however increase in the future as they could progressively take on the
role of the current generation of empirical or Gaussian models for local and street
level modelling. The “hybrid” models in Fig. 3.4 refer to the application of a
method based on numerical and statistical models.
The spatial scale of the AQ models was analyzed. Since at least 3–4 grid points
are needed to resolve a flow structure, models with a resolution coarser than 3 km
were classified as “regional scale” (5–50 km) while models with a resolution
coarser than 500 m were considered as “urban scale” (1–5 km). The “local scale”
(up to 1 km) models were those with a resolution between 500 and 10 m and finally
“street scale” models are those with a resolution in the order of meters.
In total, the 59 air quality studies with up to 3 AQ models each, lead to a total of
177 different model setups (Fig. 3.4). Among RP studies, 40 % of AQ models were
for the regional scale, 30 % at the urban scale, 13 % at the local scale, and 11 % at
street scale. For the remaining 6 % model setups no information was given on
resolution or range of scales.
Although the majority of the AQP applications regard regional and urban scales,
exceedances of air quality limit values occur at traffic-induced hot spots to a large
0%
10%
20%
30%
40%
50%
60%
AQP (59 answers)
RP (32 answers)
Fig. 3.3 Model types as used in AQP (blue) and RP (red)
3 Current European AQ Planning at Regional …
43