

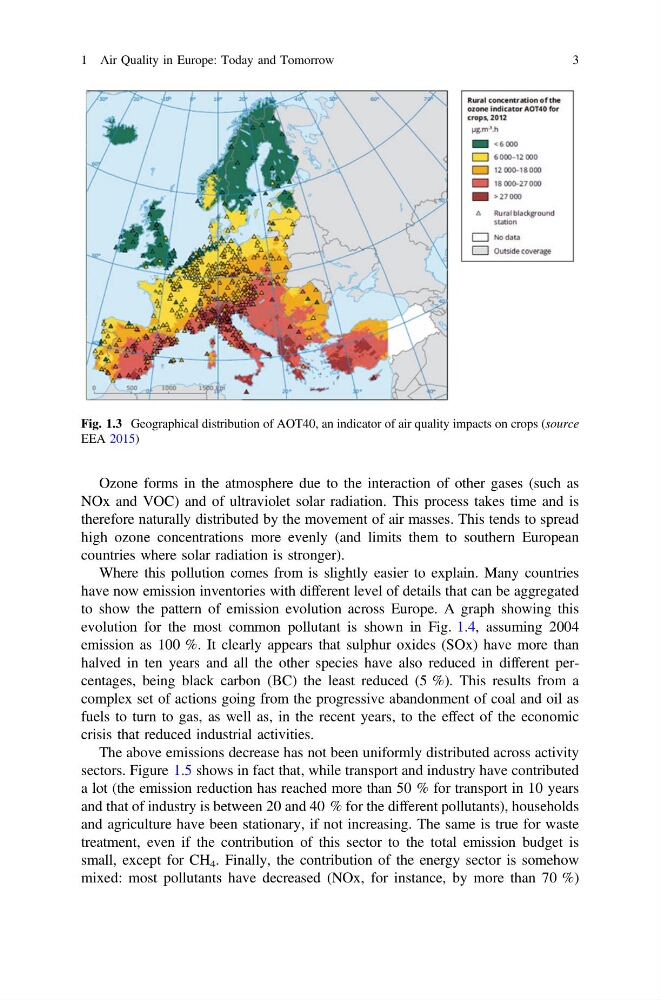
Ozone forms in the atmosphere due to the interaction of other gases (such as
NOx and VOC) and of ultraviolet solar radiation. This process takes time and is
therefore naturally distributed by the movement of air masses. This tends to spread
high ozone concentrations more evenly (and limits them to southern European
countries where solar radiation is stronger).
Where this pollution comes from is slightly easier to explain. Many countries
have now emission inventories with different level of details that can be aggregated
to show the pattern of emission evolution across Europe. A graph showing this
evolution for the most common pollutant is shown in Fig. 1.4, assuming 2004
emission as 100 %. It clearly appears that sulphur oxides (SOx) have more than
halved in ten years and all the other species have also reduced in different percentages, being black carbon (BC) the least reduced (5 %). This results from a
complex set of actions going from the progressive abandonment of coal and oil as
fuels to turn to gas, as well as, in the recent years, to the effect of the economic
crisis that reduced industrial activities.
The above emissions decrease has not been uniformly distributed across activity
sectors. Figure 1.5 shows in fact that, while transport and industry have contributed
a lot (the emission reduction has reached more than 50 % for transport in 10 years
and that of industry is between 20 and 40 % for the different pollutants), households
and agriculture have been stationary, if not increasing. The same is true for waste
treatment, even if the contribution of this sector to the total emission budget is
small, except for CH 4 . Finally, the contribution of the energy sector is somehow
mixed: most pollutants have decreased (NOx, for instance, by more than 70 %)
Fig. 1.3 Geographical distribution of AOT40, an indicator of air quality impacts on crops (source
EEA 2015)
1 Air Quality in Europe: Today and Tomorrow
3
NOx and VOC) and of ultraviolet solar radiation. This process takes time and is
therefore naturally distributed by the movement of air masses. This tends to spread
high ozone concentrations more evenly (and limits them to southern European
countries where solar radiation is stronger).
Where this pollution comes from is slightly easier to explain. Many countries
have now emission inventories with different level of details that can be aggregated
to show the pattern of emission evolution across Europe. A graph showing this
evolution for the most common pollutant is shown in Fig. 1.4, assuming 2004
emission as 100 %. It clearly appears that sulphur oxides (SOx) have more than
halved in ten years and all the other species have also reduced in different percentages, being black carbon (BC) the least reduced (5 %). This results from a
complex set of actions going from the progressive abandonment of coal and oil as
fuels to turn to gas, as well as, in the recent years, to the effect of the economic
crisis that reduced industrial activities.
The above emissions decrease has not been uniformly distributed across activity
sectors. Figure 1.5 shows in fact that, while transport and industry have contributed
a lot (the emission reduction has reached more than 50 % for transport in 10 years
and that of industry is between 20 and 40 % for the different pollutants), households
and agriculture have been stationary, if not increasing. The same is true for waste
treatment, even if the contribution of this sector to the total emission budget is
small, except for CH 4 . Finally, the contribution of the energy sector is somehow
mixed: most pollutants have decreased (NOx, for instance, by more than 70 %)
Fig. 1.3 Geographical distribution of AOT40, an indicator of air quality impacts on crops (source
EEA 2015)
1 Air Quality in Europe: Today and Tomorrow
3