

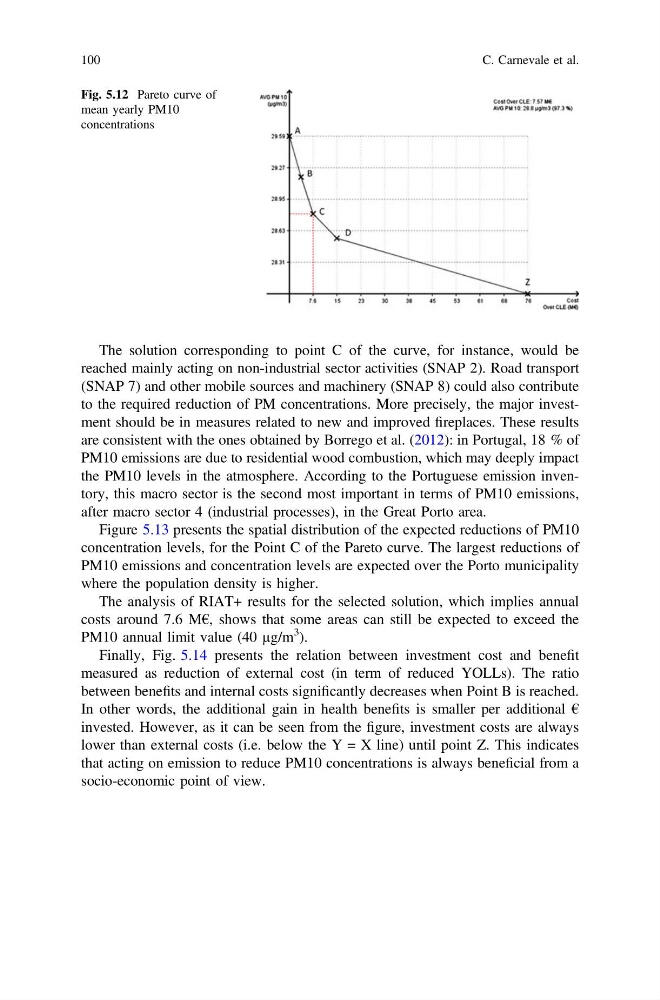
The solution corresponding to point C of the curve, for instance, would be
reached mainly acting on non-industrial sector activities (SNAP 2). Road transport
(SNAP 7) and other mobile sources and machinery (SNAP 8) could also contribute
to the required reduction of PM concentrations. More precisely, the major investment should be in measures related to new and improved fireplaces. These results
are consistent with the ones obtained by Borrego et al. (2012): in Portugal, 18 % of
PM10 emissions are due to residential wood combustion, which may deeply impact
the PM10 levels in the atmosphere. According to the Portuguese emission inventory, this macro sector is the second most important in terms of PM10 emissions,
after macro sector 4 (industrial processes), in the Great Porto area.
Figure 5.13 presents the spatial distribution of the expected reductions of PM10
concentration levels, for the Point C of the Pareto curve. The largest reductions of
PM10 emissions and concentration levels are expected over the Porto municipality
where the population density is higher.
The analysis of RIAT+ results for the selected solution, which implies annual
costs around 7.6 M€, shows that some areas can still be expected to exceed the
PM10 annual limit value (40 µg/m
3
).
Finally, Fig. 5.14 presents the relation between investment cost and benefit
measured as reduction of external cost (in term of reduced YOLLs). The ratio
between benefits and internal costs significantly decreases when Point B is reached.
In other words, the additional gain in health benefits is smaller per additional €
invested. However, as it can be seen from the figure, investment costs are always
lower than external costs (i.e. below the Y = X line) until point Z. This indicates
that acting on emission to reduce PM10 concentrations is always beneficial from a
socio-economic point of view.
Fig. 5.12 Pareto curve of
mean yearly PM10
concentrations
100
C. Carnevale et al.
reached mainly acting on non-industrial sector activities (SNAP 2). Road transport
(SNAP 7) and other mobile sources and machinery (SNAP 8) could also contribute
to the required reduction of PM concentrations. More precisely, the major investment should be in measures related to new and improved fireplaces. These results
are consistent with the ones obtained by Borrego et al. (2012): in Portugal, 18 % of
PM10 emissions are due to residential wood combustion, which may deeply impact
the PM10 levels in the atmosphere. According to the Portuguese emission inventory, this macro sector is the second most important in terms of PM10 emissions,
after macro sector 4 (industrial processes), in the Great Porto area.
Figure 5.13 presents the spatial distribution of the expected reductions of PM10
concentration levels, for the Point C of the Pareto curve. The largest reductions of
PM10 emissions and concentration levels are expected over the Porto municipality
where the population density is higher.
The analysis of RIAT+ results for the selected solution, which implies annual
costs around 7.6 M€, shows that some areas can still be expected to exceed the
PM10 annual limit value (40 µg/m
3
).
Finally, Fig. 5.14 presents the relation between investment cost and benefit
measured as reduction of external cost (in term of reduced YOLLs). The ratio
between benefits and internal costs significantly decreases when Point B is reached.
In other words, the additional gain in health benefits is smaller per additional €
invested. However, as it can be seen from the figure, investment costs are always
lower than external costs (i.e. below the Y = X line) until point Z. This indicates
that acting on emission to reduce PM10 concentrations is always beneficial from a
socio-economic point of view.
Fig. 5.12 Pareto curve of
mean yearly PM10
concentrations
100
C. Carnevale et al.