

5.4.4 Results
RIAT+ was applied in the optimization mode and Fig. 5.12 shows the Pareto
optimal (efficient) solutions over the Great Porto domain. The horizontal axis of the
figure shows the implementation costs (over CLE) of abatement measures
expressed in M€, and the vertical axis reports the corresponding efficient AQI
value. It shows that a PM10 mean concentration of 28.8 lg/m3 can be reached by
adopting emission reduction technologies costing around 7.6 Million € per year
(see point C). Points A and Z represent the extreme cases where no actions or
maximum feasible reductions are implemented. The other points of the Pareto
Curve are intermediate solutions.
Table 5.3 ANN best parameters for PM10 annual mean index
ANNs features
Value
Nodes in the input layer
16
Hidden layer transfer function
Log-Sigmoid
Nodes of the hidden layer
20
Output layer transfer function
Linear
Nodes in the output layer
1
Training function
Levenberg-Marquardt backpropagation
Radius of influence (n° of cells)
4
Training set (n° of cells)
6784
Validation set (n° of cells)
1696
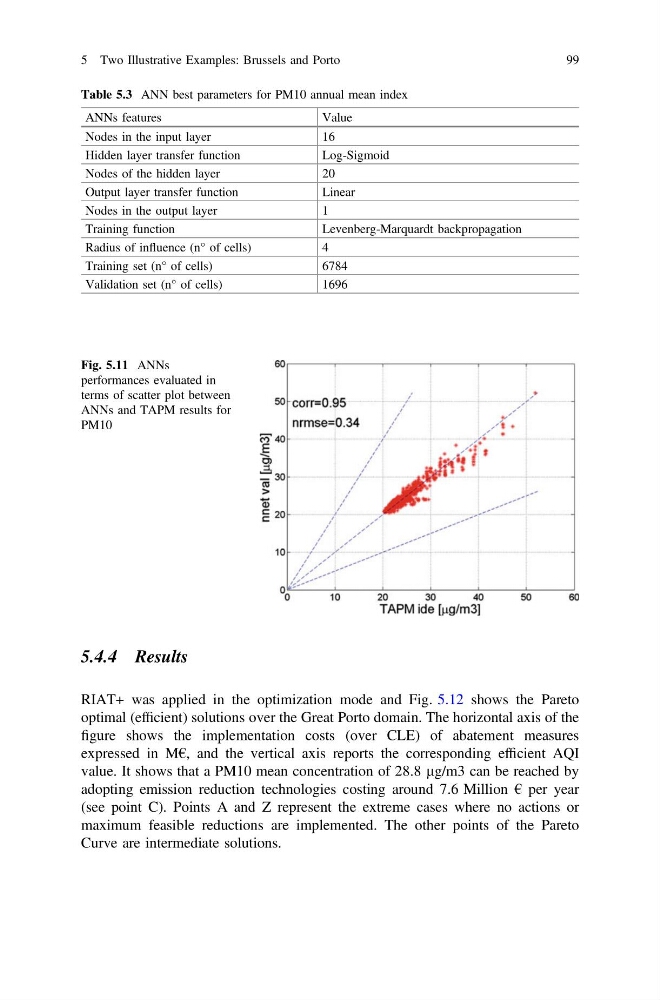
Fig. 5.11 ANNs
performances evaluated in
terms of scatter plot between
ANNs and TAPM results for
PM10
5 Two Illustrative Examples: Brussels and Porto
99
RIAT+ was applied in the optimization mode and Fig. 5.12 shows the Pareto
optimal (efficient) solutions over the Great Porto domain. The horizontal axis of the
figure shows the implementation costs (over CLE) of abatement measures
expressed in M€, and the vertical axis reports the corresponding efficient AQI
value. It shows that a PM10 mean concentration of 28.8 lg/m3 can be reached by
adopting emission reduction technologies costing around 7.6 Million € per year
(see point C). Points A and Z represent the extreme cases where no actions or
maximum feasible reductions are implemented. The other points of the Pareto
Curve are intermediate solutions.
Table 5.3 ANN best parameters for PM10 annual mean index
ANNs features
Value
Nodes in the input layer
16
Hidden layer transfer function
Log-Sigmoid
Nodes of the hidden layer
20
Output layer transfer function
Linear
Nodes in the output layer
1
Training function
Levenberg-Marquardt backpropagation
Radius of influence (n° of cells)
4
Training set (n° of cells)
6784
Validation set (n° of cells)
1696
Fig. 5.11 ANNs
performances evaluated in
terms of scatter plot between
ANNs and TAPM results for
PM10
5 Two Illustrative Examples: Brussels and Porto
99