

350
S. S. Roy et al.
2.1 Graphical Representation
An equivalent way to conceptualize the entropic functions obtained for different
bipartitions is through the following graphical representation we outline here.
Similar to Venn diagrams, which illustrate the logical relationships between two
or more sets, here we present the schematic representation of the entropy values of
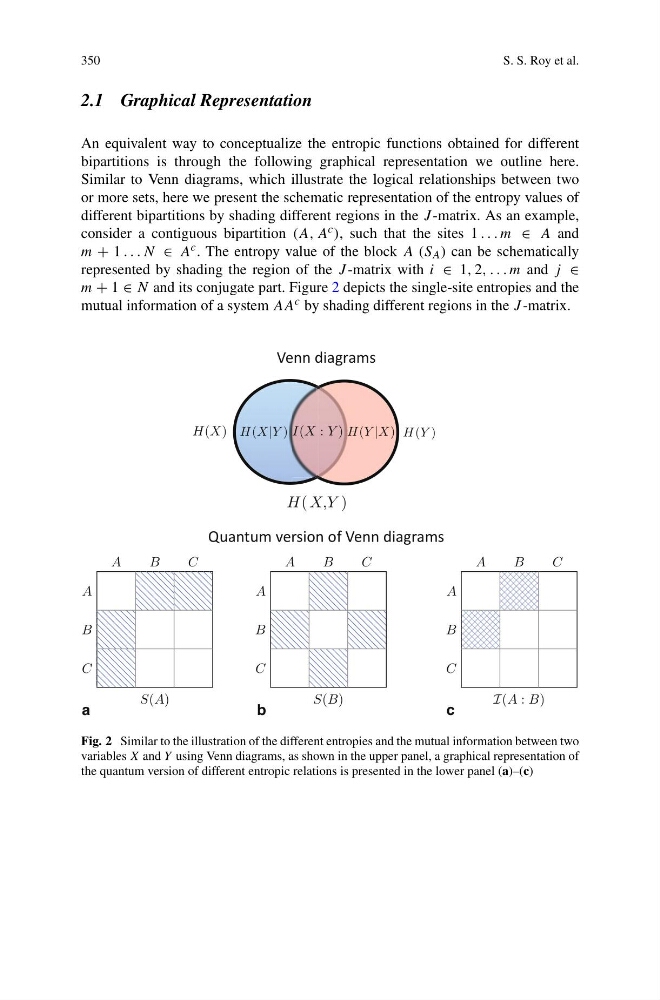
different bipartitions by shading different regions in the J -matrix. As an example,
consider a contiguous bipartition (A, A c ), such that the sites 1 . . . m ∈ A and
m + 1 . . . N ∈ A c . The entropy value of the block A (S A ) can be schematically
represented by shading the region of the J -matrix with i ∈ 1, 2, . . . m and j ∈
m + 1 ∈ N and its conjugate part. Figure 2 depicts the single-site entropies and the
mutual information of a system AA c by shading different regions in the J -matrix.
A
B
C
A
B
C
S(A)
A
B
C
a
b
c
A
B
C
S(B)
A
B
C
A
B
C
I(A : B)
H( X,Y )
H (X |Y )
H (Y |X )
H(X)
H (Y )
I(X : Y )
Quantum version of Venn diagrams
Venn diagrams
Fig. 2 Similar to the illustration of the different entropies and the mutual information between two
variables X and Y using Venn diagrams, as shown in the upper panel, a graphical representation of
the quantum version of different entropic relations is presented in the lower panel (a)–(c)
S. S. Roy et al.
2.1 Graphical Representation
An equivalent way to conceptualize the entropic functions obtained for different
bipartitions is through the following graphical representation we outline here.
Similar to Venn diagrams, which illustrate the logical relationships between two
or more sets, here we present the schematic representation of the entropy values of
different bipartitions by shading different regions in the J -matrix. As an example,
consider a contiguous bipartition (A, A c ), such that the sites 1 . . . m ∈ A and
m + 1 . . . N ∈ A c . The entropy value of the block A (S A ) can be schematically
represented by shading the region of the J -matrix with i ∈ 1, 2, . . . m and j ∈
m + 1 ∈ N and its conjugate part. Figure 2 depicts the single-site entropies and the
mutual information of a system AA c by shading different regions in the J -matrix.
A
B
C
A
B
C
S(A)
A
B
C
a
b
c
A
B
C
S(B)
A
B
C
A
B
C
I(A : B)
H( X,Y )
H (X |Y )
H (Y |X )
H(X)
H (Y )
I(X : Y )
Quantum version of Venn diagrams
Venn diagrams
Fig. 2 Similar to the illustration of the different entropies and the mutual information between two
variables X and Y using Venn diagrams, as shown in the upper panel, a graphical representation of
the quantum version of different entropic relations is presented in the lower panel (a)–(c)