

61
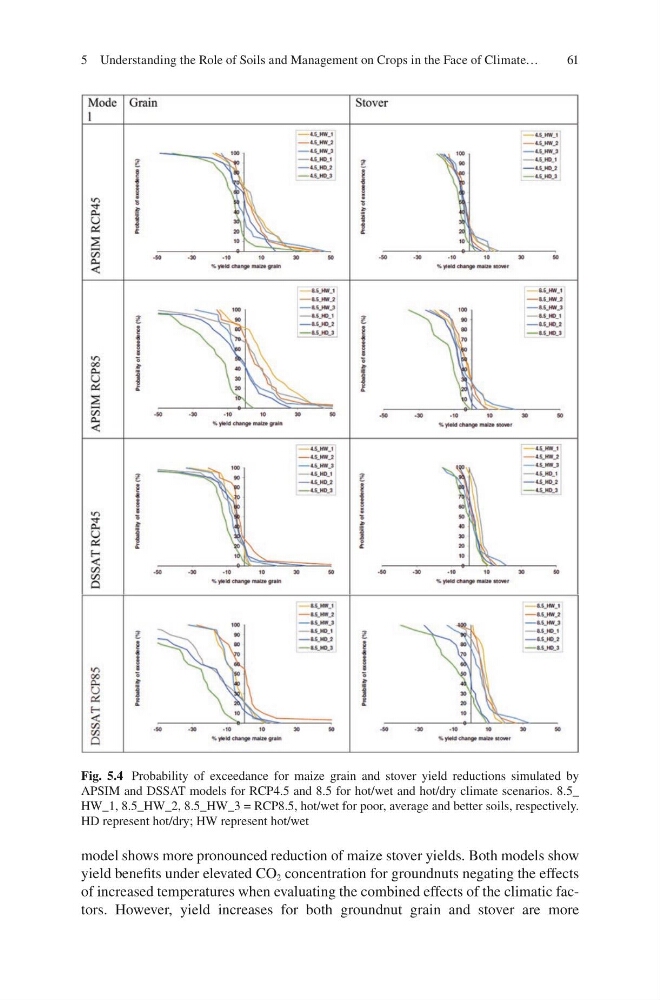
Fig. 5.4 Probability of exceedance for maize grain and stover yield reductions simulated by
APSIM and DSSAT models for RCP4.5 and 8.5 for hot/wet and hot/dry climate scenarios. 8.5_
HW_1, 8.5_HW_2, 8.5_HW_3 = RCP8.5, hot/wet for poor, average and better soils, respectively.
HD represent hot/dry; HW represent hot/wet
model shows more pronounced reduction of maize stover yields. Both models show
yield benefits under elevated CO 2 concentration for groundnuts negating the effects
of increased temperatures when evaluating the combined effects of the climatic factors. However, yield increases for both groundnut grain and stover are more
5 Understanding the Role of Soils and Management on Crops in the Face of Climate…
Fig. 5.4 Probability of exceedance for maize grain and stover yield reductions simulated by
APSIM and DSSAT models for RCP4.5 and 8.5 for hot/wet and hot/dry climate scenarios. 8.5_
HW_1, 8.5_HW_2, 8.5_HW_3 = RCP8.5, hot/wet for poor, average and better soils, respectively.
HD represent hot/dry; HW represent hot/wet
model shows more pronounced reduction of maize stover yields. Both models show
yield benefits under elevated CO 2 concentration for groundnuts negating the effects
of increased temperatures when evaluating the combined effects of the climatic factors. However, yield increases for both groundnut grain and stover are more
5 Understanding the Role of Soils and Management on Crops in the Face of Climate…