

19
projected to be completely different from what has ever been experienced historically (Girvetz et al. 2009, climatewizard.ciat.cgiar.org).
Future precipitation is much more difficult to model (Sillmann et al. 2013;
Ramirez-Villegas et al. 2013). The median of the CMIP5 models indicates that by
2050, under the higher emission scenario (RCP 8.5, Fig. 2.4), annual precipitation
will increase across much of eastern and central Africa, while decreasing across
parts of southern, western and northern Africa (Fig. 2.4). Increases of over 200 mm
and more than 25% annually are shown in some places, as well as decreases of over
100 mm and more than 20% in other places. Not all climate models agree on the
magnitude or even direction of change. However, there are some places with high
agreement among the climate models: over 80% of the climate models agree on
decreased precipitation in the future for some parts of northern and southern Africa
(Niang et al. 2014).
Precipitation is also projected to change differently in different months, with
alterations to the onset, length and cessation of the growing season. For example, in
Tanzania precipitation is projected to increase during the middle of the wet season
(November–May) and to decrease at the wet season’s beginning (September–
October) and end (May–June) (see http://climatewizard.ciat.cgiar.org/SBSTA/
Africa_2050/). Overall precipitation is projected to increase, but within a shorter
time frame, indicating both shortening of the rainy season and an increased frequency of extreme precipitation events.
Even in areas experiencing increased precipitation, crop production systems can
be affected by worsening water stress. Depending on the timing of rainfall, the
amount of the temperature increase, and the changes in cloud cover (and hence in
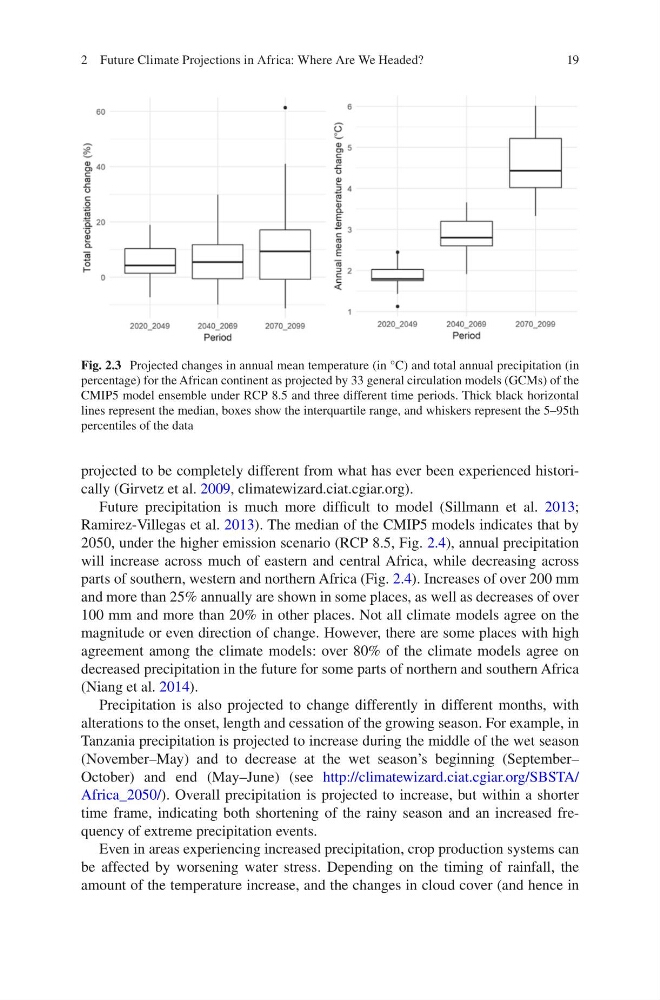
Fig. 2.3 Projected changes in annual mean temperature (in °C) and total annual precipitation (in
percentage) for the African continent as projected by 33 general circulation models (GCMs) of the
CMIP5 model ensemble under RCP 8.5 and three different time periods. Thick black horizontal
lines represent the median, boxes show the interquartile range, and whiskers represent the 5–95th
percentiles of the data
2 Future Climate Projections in Africa: Where Are We Headed?
projected to be completely different from what has ever been experienced historically (Girvetz et al. 2009, climatewizard.ciat.cgiar.org).
Future precipitation is much more difficult to model (Sillmann et al. 2013;
Ramirez-Villegas et al. 2013). The median of the CMIP5 models indicates that by
2050, under the higher emission scenario (RCP 8.5, Fig. 2.4), annual precipitation
will increase across much of eastern and central Africa, while decreasing across
parts of southern, western and northern Africa (Fig. 2.4). Increases of over 200 mm
and more than 25% annually are shown in some places, as well as decreases of over
100 mm and more than 20% in other places. Not all climate models agree on the
magnitude or even direction of change. However, there are some places with high
agreement among the climate models: over 80% of the climate models agree on
decreased precipitation in the future for some parts of northern and southern Africa
(Niang et al. 2014).
Precipitation is also projected to change differently in different months, with
alterations to the onset, length and cessation of the growing season. For example, in
Tanzania precipitation is projected to increase during the middle of the wet season
(November–May) and to decrease at the wet season’s beginning (September–
October) and end (May–June) (see http://climatewizard.ciat.cgiar.org/SBSTA/
Africa_2050/). Overall precipitation is projected to increase, but within a shorter
time frame, indicating both shortening of the rainy season and an increased frequency of extreme precipitation events.
Even in areas experiencing increased precipitation, crop production systems can
be affected by worsening water stress. Depending on the timing of rainfall, the
amount of the temperature increase, and the changes in cloud cover (and hence in
Fig. 2.3 Projected changes in annual mean temperature (in °C) and total annual precipitation (in
percentage) for the African continent as projected by 33 general circulation models (GCMs) of the
CMIP5 model ensemble under RCP 8.5 and three different time periods. Thick black horizontal
lines represent the median, boxes show the interquartile range, and whiskers represent the 5–95th
percentiles of the data
2 Future Climate Projections in Africa: Where Are We Headed?