

220
18.3.2 The Impacts on Household Welfare Indicators
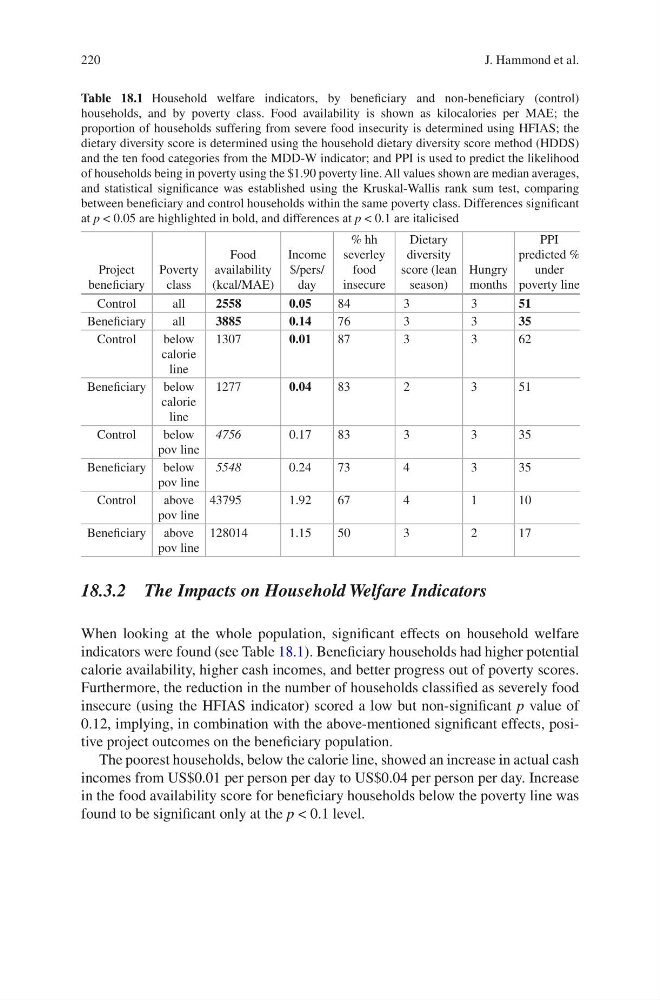
When looking at the whole population, significant effects on household welfare
indicators were found (see Table 18.1). Beneficiary households had higher potential
calorie availability, higher cash incomes, and better progress out of poverty scores.
Furthermore, the reduction in the number of households classified as severely food
insecure (using the HFIAS indicator) scored a low but non-significant p value of
0.12, implying, in combination with the above-mentioned significant effects, positive project outcomes on the beneficiary population.
The poorest households, below the calorie line, showed an increase in actual cash
incomes from US$0.01 per person per day to US$0.04 per person per day. Increase
in the food availability score for beneficiary households below the poverty line was
found to be significant only at the p < 0.1 level.
Table 18.1 Household welfare indicators, by beneficiary and non-beneficiary (control)
households, and by poverty class. Food availability is shown as kilocalories per MAE; the
proportion of households suffering from severe food insecurity is determined using HFIAS; the
dietary diversity score is determined using the household dietary diversity score method (HDDS)
and the ten food categories from the MDD-W indicator; and PPI is used to predict the likelihood
of households being in poverty using the $1.90 poverty line. All values shown are median averages,
and statistical significance was established using the Kruskal-Wallis rank sum test, comparing
between beneficiary and control households within the same poverty class. Differences significant
at p < 0.05 are highlighted in bold, and differences at p < 0.1 are italicised
Project
beneficiary
Poverty
class
Food
availability
(kcal/MAE)
Income
$/pers/
day
% hh
severley
food
insecure
Dietary
diversity
score (lean
season)
Hungry
months
PPI
predicted %
under
poverty line
Control
all
2558
0.05
84
3
3
51
Beneficiary
all
3885
0.14
76
3
3
35
Control
below
calorie
line
1307
0.01
87
3
3
62
Beneficiary below
calorie
line
1277
0.04
83
2
3
51
Control
below
pov line
4756
0.17
83
3
3
35
Beneficiary below
pov line
5548
0.24
73
4
3
35
Control
above
pov line
43795
1.92
67
4
1
10
Beneficiary above
pov line
128014
1.15
50
3
2
17
J. Hammond et al.
18.3.2 The Impacts on Household Welfare Indicators
When looking at the whole population, significant effects on household welfare
indicators were found (see Table 18.1). Beneficiary households had higher potential
calorie availability, higher cash incomes, and better progress out of poverty scores.
Furthermore, the reduction in the number of households classified as severely food
insecure (using the HFIAS indicator) scored a low but non-significant p value of
0.12, implying, in combination with the above-mentioned significant effects, positive project outcomes on the beneficiary population.
The poorest households, below the calorie line, showed an increase in actual cash
incomes from US$0.01 per person per day to US$0.04 per person per day. Increase
in the food availability score for beneficiary households below the poverty line was
found to be significant only at the p < 0.1 level.
Table 18.1 Household welfare indicators, by beneficiary and non-beneficiary (control)
households, and by poverty class. Food availability is shown as kilocalories per MAE; the
proportion of households suffering from severe food insecurity is determined using HFIAS; the
dietary diversity score is determined using the household dietary diversity score method (HDDS)
and the ten food categories from the MDD-W indicator; and PPI is used to predict the likelihood
of households being in poverty using the $1.90 poverty line. All values shown are median averages,
and statistical significance was established using the Kruskal-Wallis rank sum test, comparing
between beneficiary and control households within the same poverty class. Differences significant
at p < 0.05 are highlighted in bold, and differences at p < 0.1 are italicised
Project
beneficiary
Poverty
class
Food
availability
(kcal/MAE)
Income
$/pers/
day
% hh
severley
food
insecure
Dietary
diversity
score (lean
season)
Hungry
months
PPI
predicted %
under
poverty line
Control
all
2558
0.05
84
3
3
51
Beneficiary
all
3885
0.14
76
3
3
35
Control
below
calorie
line
1307
0.01
87
3
3
62
Beneficiary below
calorie
line
1277
0.04
83
2
3
51
Control
below
pov line
4756
0.17
83
3
3
35
Beneficiary below
pov line
5548
0.24
73
4
3
35
Control
above
pov line
43795
1.92
67
4
1
10
Beneficiary above
pov line
128014
1.15
50
3
2
17
J. Hammond et al.