

219
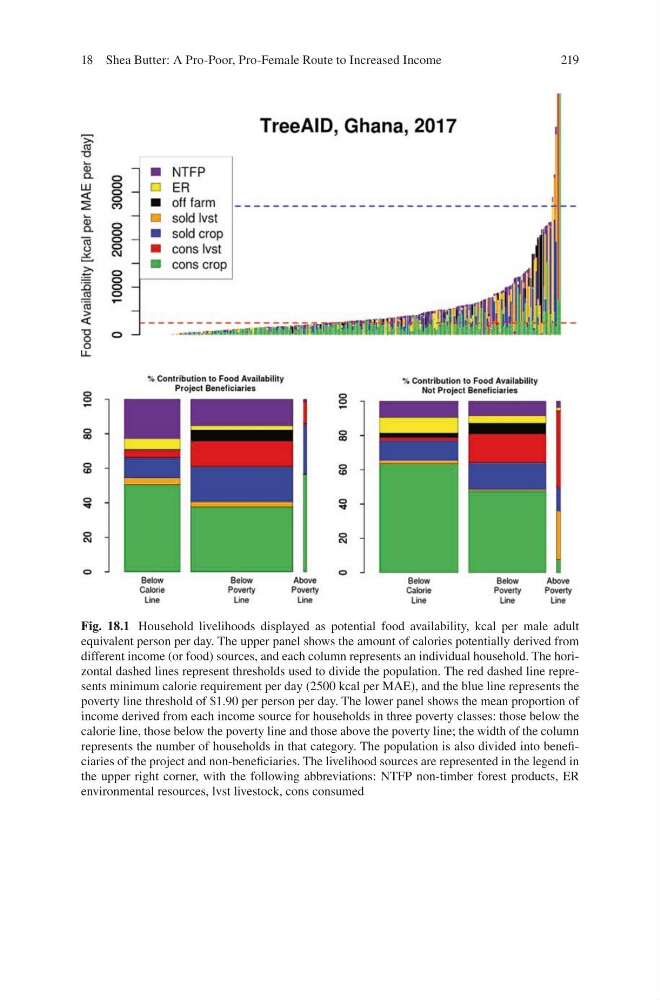
Fig. 18.1 Household livelihoods displayed as potential food availability, kcal per male adult
equivalent person per day. The upper panel shows the amount of calories potentially derived from
different income (or food) sources, and each column represents an individual household. The horizontal dashed lines represent thresholds used to divide the population. The red dashed line represents minimum calorie requirement per day (2500 kcal per MAE), and the blue line represents the
poverty line threshold of $1.90 per person per day. The lower panel shows the mean proportion of
income derived from each income source for households in three poverty classes: those below the
calorie line, those below the poverty line and those above the poverty line; the width of the column
represents the number of households in that category. The population is also divided into beneficiaries of the project and non-beneficiaries. The livelihood sources are represented in the legend in
the upper right corner, with the following abbreviations: NTFP non-timber forest products, ER
environmental resources, lvst livestock, cons consumed
18 Shea Butter: A Pro-Poor, Pro-Female Route to Increased Income
Fig. 18.1 Household livelihoods displayed as potential food availability, kcal per male adult
equivalent person per day. The upper panel shows the amount of calories potentially derived from
different income (or food) sources, and each column represents an individual household. The horizontal dashed lines represent thresholds used to divide the population. The red dashed line represents minimum calorie requirement per day (2500 kcal per MAE), and the blue line represents the
poverty line threshold of $1.90 per person per day. The lower panel shows the mean proportion of
income derived from each income source for households in three poverty classes: those below the
calorie line, those below the poverty line and those above the poverty line; the width of the column
represents the number of households in that category. The population is also divided into beneficiaries of the project and non-beneficiaries. The livelihood sources are represented in the legend in
the upper right corner, with the following abbreviations: NTFP non-timber forest products, ER
environmental resources, lvst livestock, cons consumed
18 Shea Butter: A Pro-Poor, Pro-Female Route to Increased Income