

183
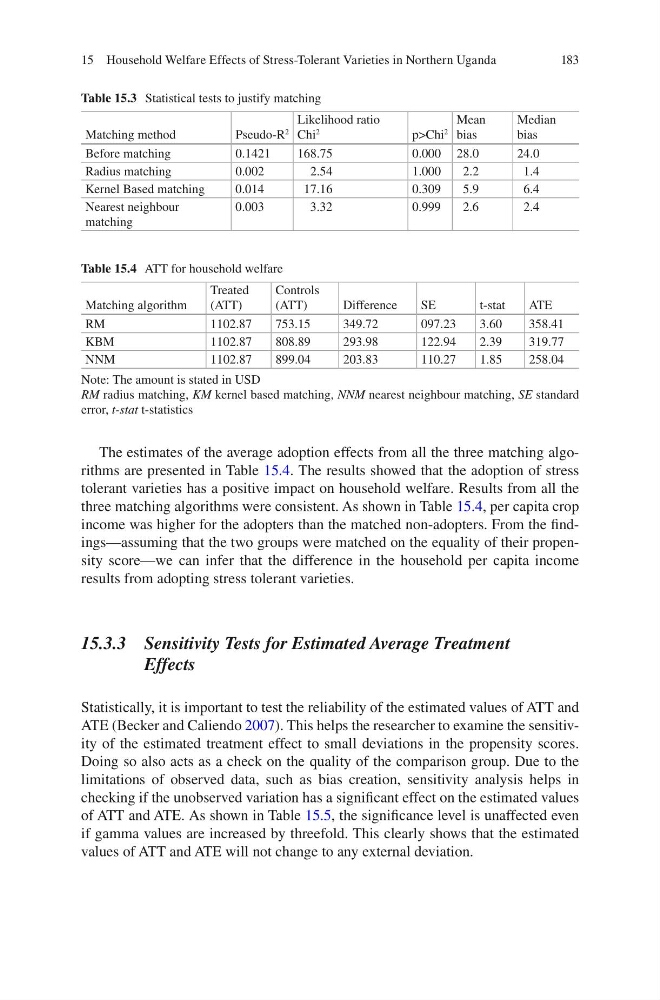
The estimates of the average adoption effects from all the three matching algorithms are presented in Table 15.4. The results showed that the adoption of stress
tolerant varieties has a positive impact on household welfare. Results from all the
three matching algorithms were consistent. As shown in Table 15.4, per capita crop
income was higher for the adopters than the matched non-adopters. From the findings—assuming that the two groups were matched on the equality of their propensity score—we can infer that the difference in the household per capita income
results from adopting stress tolerant varieties.
15.3.3 Sensitivity Tests for Estimated Average Treatment
Effects
Statistically, it is important to test the reliability of the estimated values of ATT and
ATE (Becker and Caliendo 2007). This helps the researcher to examine the sensitivity of the estimated treatment effect to small deviations in the propensity scores.
Doing so also acts as a check on the quality of the comparison group. Due to the
limitations of observed data, such as bias creation, sensitivity analysis helps in
checking if the unobserved variation has a significant effect on the estimated values
of ATT and ATE. As shown in Table 15.5, the significance level is unaffected even
if gamma values are increased by threefold. This clearly shows that the estimated
values of ATT and ATE will not change to any external deviation.
Table 15.3 Statistical tests to justify matching
Matching method
Pseudo-R
2
Likelihood ratio
Chi
2
p>Chi
2
Mean
bias
Median
bias
Before matching
0.1421
168.75
0.000 28.0
24.0
Radius matching
0.002
2.54
1.000
2.2
1.4
Kernel Based matching
0.014
17.16
0.309
5.9
6.4
Nearest neighbour
matching
0.003
3.32
0.999
2.6
2.4
Table 15.4 ATT for household welfare
Matching algorithm
Treated
(ATT)
Controls
(ATT)
Difference
SE
t-stat
ATE
RM
1102.87
753.15
349.72
097.23
3.60
358.41
KBM
1102.87
808.89
293.98
122.94
2.39
319.77
NNM
1102.87
899.04
203.83
110.27
1.85
258.04
Note: The amount is stated in USD
RM radius matching, KM kernel based matching, NNM nearest neighbour matching, SE standard
error, t-stat t-statistics
15 Household Welfare Effects of Stress-Tolerant Varieties in Northern Uganda
The estimates of the average adoption effects from all the three matching algorithms are presented in Table 15.4. The results showed that the adoption of stress
tolerant varieties has a positive impact on household welfare. Results from all the
three matching algorithms were consistent. As shown in Table 15.4, per capita crop
income was higher for the adopters than the matched non-adopters. From the findings—assuming that the two groups were matched on the equality of their propensity score—we can infer that the difference in the household per capita income
results from adopting stress tolerant varieties.
15.3.3 Sensitivity Tests for Estimated Average Treatment
Effects
Statistically, it is important to test the reliability of the estimated values of ATT and
ATE (Becker and Caliendo 2007). This helps the researcher to examine the sensitivity of the estimated treatment effect to small deviations in the propensity scores.
Doing so also acts as a check on the quality of the comparison group. Due to the
limitations of observed data, such as bias creation, sensitivity analysis helps in
checking if the unobserved variation has a significant effect on the estimated values
of ATT and ATE. As shown in Table 15.5, the significance level is unaffected even
if gamma values are increased by threefold. This clearly shows that the estimated
values of ATT and ATE will not change to any external deviation.
Table 15.3 Statistical tests to justify matching
Matching method
Pseudo-R
2
Likelihood ratio
Chi
2
p>Chi
2
Mean
bias
Median
bias
Before matching
0.1421
168.75
0.000 28.0
24.0
Radius matching
0.002
2.54
1.000
2.2
1.4
Kernel Based matching
0.014
17.16
0.309
5.9
6.4
Nearest neighbour
matching
0.003
3.32
0.999
2.6
2.4
Table 15.4 ATT for household welfare
Matching algorithm
Treated
(ATT)
Controls
(ATT)
Difference
SE
t-stat
ATE
RM
1102.87
753.15
349.72
097.23
3.60
358.41
KBM
1102.87
808.89
293.98
122.94
2.39
319.77
NNM
1102.87
899.04
203.83
110.27
1.85
258.04
Note: The amount is stated in USD
RM radius matching, KM kernel based matching, NNM nearest neighbour matching, SE standard
error, t-stat t-statistics
15 Household Welfare Effects of Stress-Tolerant Varieties in Northern Uganda