

178
technology and W it = 0 represents households that did not adopt; β refers to a vector
of coefficients estimated by the model. The signs and magnitude of the marginal
effects are important in explaining the effect of the independent variables on the
adoption of improved varieties or simply the propensity to adopt. A vector of independent variables is represented by í µí±¥ while ε is the error term. The choice of the
independent variables was informed by literature on the adoption of agricultural
innovations (see, for example, Manda et al. 2016). This first step generated propensity scores, that is, the estimated probabilities of households to adopt stress tolerant
varieties based on the observed covariates, í µí±¥.
In the second step, average treatment effects (ATE) were estimated based on a
matched sample of adopters and non-adopters, which was obtained using the propensity scores generated in the first step. Using this approach, we controlled for
unobserved heterogeneity due to self-selection into adopter and non-adopter groups.
The probability of self-selection bias in non-experimental studies might imply that
the adopters are systematically different from non-adopters and, if this is not adequately controlled for, the estimated impacts may be biased and the conclusion misleading. The fundamental assumption in PSM is that outcomes are independent of
treatment assignment and conditioned on explanatory variables. Furthermore, it is
assumed that there is sufficient overlap in propensity scores so that both adopters
and non-adopters have an equal probability greater than zero and less than one of
adopting improved varieties. These two underlying assumptions are, respectively,
referred to as the ‘conditional independence assumption’ and the ‘common support
assumption’. Causal effect, therefore, refers to the difference between the observed
and counterfactual household welfare. Following Becker and Caliendo (2007),
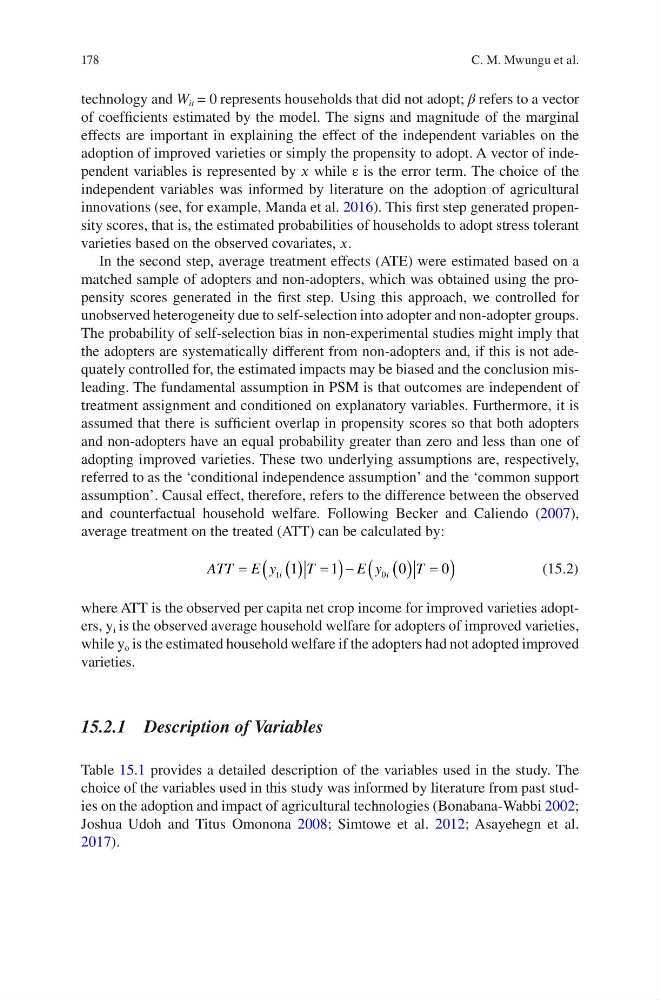
average treatment on the treated (ATT) can be calculated by:
ATT E y
T
E y
T
i
i
=
( ) =
(
) −
( ) =
(
)
1
0
1
1
0
0
(15.2)
where ATT is the observed per capita net crop income for improved varieties adopters, y i is the observed average household welfare for adopters of improved varieties,
while y o is the estimated household welfare if the adopters had not adopted improved
varieties.
15.2.1 Description of Variables
Table 15.1 provides a detailed description of the variables used in the study. The
choice of the variables used in this study was informed by literature from past studies on the adoption and impact of agricultural technologies (Bonabana-Wabbi 2002;
Joshua Udoh and Titus Omonona 2008; Simtowe et al. 2012; Asayehegn et al.
2017).
C. M. Mwungu et al.
technology and W it = 0 represents households that did not adopt; β refers to a vector
of coefficients estimated by the model. The signs and magnitude of the marginal
effects are important in explaining the effect of the independent variables on the
adoption of improved varieties or simply the propensity to adopt. A vector of independent variables is represented by í µí±¥ while ε is the error term. The choice of the
independent variables was informed by literature on the adoption of agricultural
innovations (see, for example, Manda et al. 2016). This first step generated propensity scores, that is, the estimated probabilities of households to adopt stress tolerant
varieties based on the observed covariates, í µí±¥.
In the second step, average treatment effects (ATE) were estimated based on a
matched sample of adopters and non-adopters, which was obtained using the propensity scores generated in the first step. Using this approach, we controlled for
unobserved heterogeneity due to self-selection into adopter and non-adopter groups.
The probability of self-selection bias in non-experimental studies might imply that
the adopters are systematically different from non-adopters and, if this is not adequately controlled for, the estimated impacts may be biased and the conclusion misleading. The fundamental assumption in PSM is that outcomes are independent of
treatment assignment and conditioned on explanatory variables. Furthermore, it is
assumed that there is sufficient overlap in propensity scores so that both adopters
and non-adopters have an equal probability greater than zero and less than one of
adopting improved varieties. These two underlying assumptions are, respectively,
referred to as the ‘conditional independence assumption’ and the ‘common support
assumption’. Causal effect, therefore, refers to the difference between the observed
and counterfactual household welfare. Following Becker and Caliendo (2007),
average treatment on the treated (ATT) can be calculated by:
ATT E y
T
E y
T
i
i
=
( ) =
(
) −
( ) =
(
)
1
0
1
1
0
0
(15.2)
where ATT is the observed per capita net crop income for improved varieties adopters, y i is the observed average household welfare for adopters of improved varieties,
while y o is the estimated household welfare if the adopters had not adopted improved
varieties.
15.2.1 Description of Variables
Table 15.1 provides a detailed description of the variables used in the study. The
choice of the variables used in this study was informed by literature from past studies on the adoption and impact of agricultural technologies (Bonabana-Wabbi 2002;
Joshua Udoh and Titus Omonona 2008; Simtowe et al. 2012; Asayehegn et al.
2017).
C. M. Mwungu et al.