

177
year, the temperature varies from 18 to 36 °C. The region has a wet season that
begins in March and ends in November each year. Planting of annual crops normally begins in April, while harvesting starts in July depending on the crop.
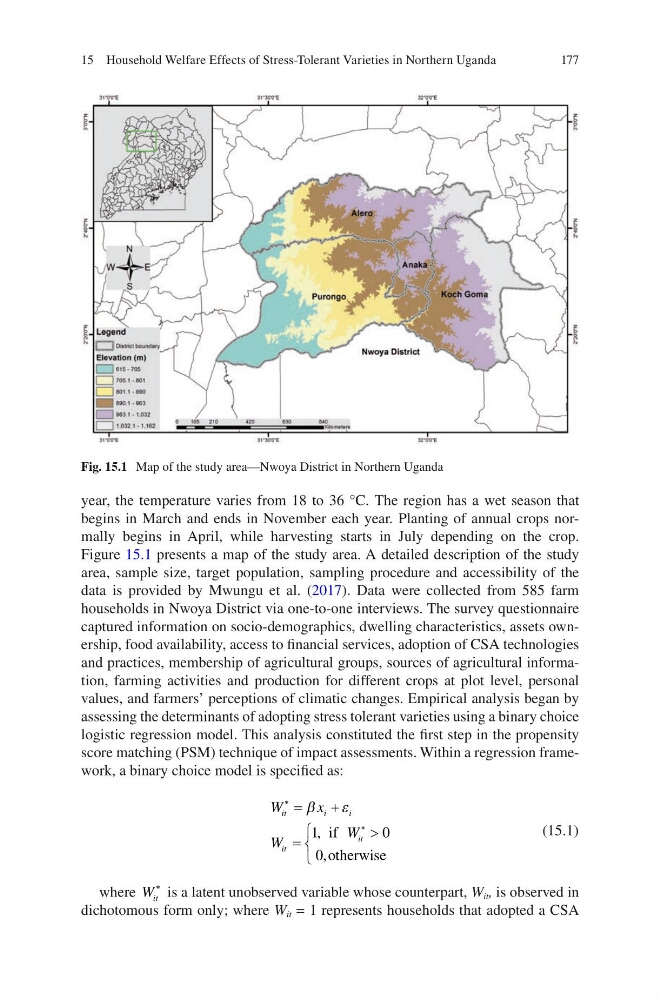
Figure 15.1 presents a map of the study area. A detailed description of the study
area, sample size, target population, sampling procedure and accessibility of the
data is provided by Mwungu et al. (2017). Data were collected from 585 farm
households in Nwoya District via one-to-one interviews. The survey questionnaire
captured information on socio-demographics, dwelling characteristics, assets ownership, food availability, access to financial services, adoption of CSA technologies
and practices, membership of agricultural groups, sources of agricultural information, farming activities and production for different crops at plot level, personal
values, and farmers’ perceptions of climatic changes. Empirical analysis began by
assessing the determinants of adopting stress tolerant varieties using a binary choice
logistic regression model. This analysis constituted the first step in the propensity
score matching (PSM) technique of impact assessments. Within a regression framework, a binary choice model is specified as:
W
x
W
W
it
i
i
it
it
∗
∗
=
+
=
>
β
ε
1
0
0
,
,
if
otherwise
(15.1)
where W it
∗ is a latent unobserved variable whose counterpart, W it , is observed in
dichotomous form only; where W it = 1 represents households that adopted a CSA
Fig. 15.1 Map of the study area—Nwoya District in Northern Uganda
15 Household Welfare Effects of Stress-Tolerant Varieties in Northern Uganda
year, the temperature varies from 18 to 36 °C. The region has a wet season that
begins in March and ends in November each year. Planting of annual crops normally begins in April, while harvesting starts in July depending on the crop.
Figure 15.1 presents a map of the study area. A detailed description of the study
area, sample size, target population, sampling procedure and accessibility of the
data is provided by Mwungu et al. (2017). Data were collected from 585 farm
households in Nwoya District via one-to-one interviews. The survey questionnaire
captured information on socio-demographics, dwelling characteristics, assets ownership, food availability, access to financial services, adoption of CSA technologies
and practices, membership of agricultural groups, sources of agricultural information, farming activities and production for different crops at plot level, personal
values, and farmers’ perceptions of climatic changes. Empirical analysis began by
assessing the determinants of adopting stress tolerant varieties using a binary choice
logistic regression model. This analysis constituted the first step in the propensity
score matching (PSM) technique of impact assessments. Within a regression framework, a binary choice model is specified as:
W
x
W
W
it
i
i
it
it
∗
∗
=
+
=
>
β
ε
1
0
0
,
,
if
otherwise
(15.1)
where W it
∗ is a latent unobserved variable whose counterpart, W it , is observed in
dichotomous form only; where W it = 1 represents households that adopted a CSA
Fig. 15.1 Map of the study area—Nwoya District in Northern Uganda
15 Household Welfare Effects of Stress-Tolerant Varieties in Northern Uganda