

588
J. Jaisawal et al.
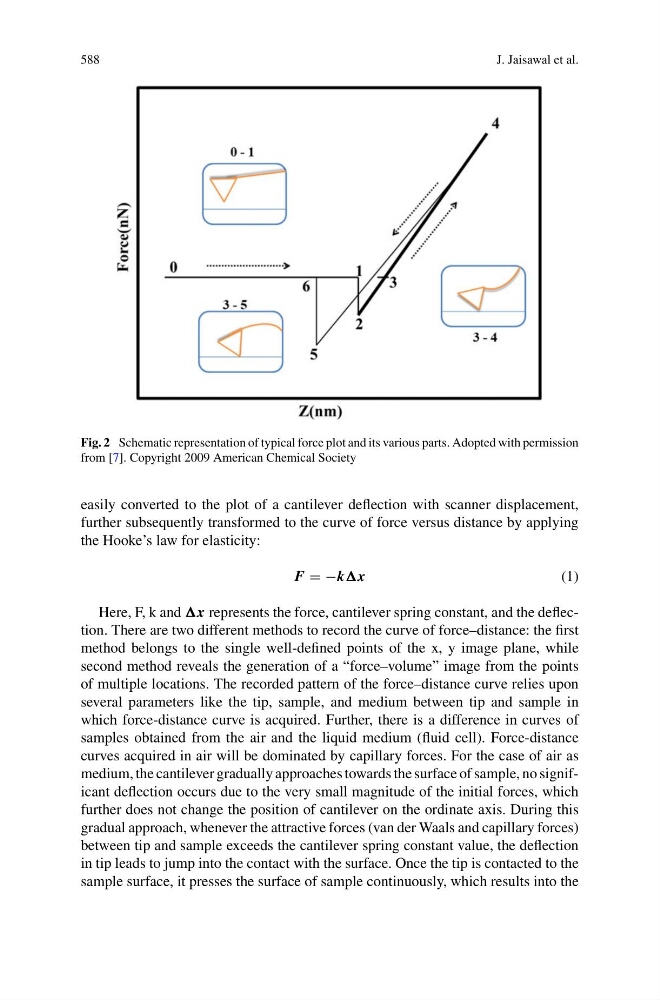
Fig. 2 Schematic representation of typical force plot and its various parts. Adopted with permission
from [7]. Copyright 2009 American Chemical Society
easily converted to the plot of a cantilever deflection with scanner displacement,
further subsequently transformed to the curve of force versus distance by applying
the Hooke’s law for elasticity:
F = −kx
(1)
Here, F, k and x represents the force, cantilever spring constant, and the deflection. There are two different methods to record the curve of force–distance: the first
method belongs to the single well-defined points of the x, y image plane, while
second method reveals the generation of a “force–volume” image from the points
of multiple locations. The recorded pattern of the force–distance curve relies upon
several parameters like the tip, sample, and medium between tip and sample in
which force-distance curve is acquired. Further, there is a difference in curves of
samples obtained from the air and the liquid medium (fluid cell). Force-distance
curves acquired in air will be dominated by capillary forces. For the case of air as
medium, the cantilever gradually approaches towards the surface of sample, no significant deflection occurs due to the very small magnitude of the initial forces, which
further does not change the position of cantilever on the ordinate axis. During this
gradual approach, whenever the attractive forces (van der Waals and capillary forces)
between tip and sample exceeds the cantilever spring constant value, the deflection
in tip leads to jump into the contact with the surface. Once the tip is contacted to the
sample surface, it presses the surface of sample continuously, which results into the
J. Jaisawal et al.
Fig. 2 Schematic representation of typical force plot and its various parts. Adopted with permission
from [7]. Copyright 2009 American Chemical Society
easily converted to the plot of a cantilever deflection with scanner displacement,
further subsequently transformed to the curve of force versus distance by applying
the Hooke’s law for elasticity:
F = −kx
(1)
Here, F, k and x represents the force, cantilever spring constant, and the deflection. There are two different methods to record the curve of force–distance: the first
method belongs to the single well-defined points of the x, y image plane, while
second method reveals the generation of a “force–volume” image from the points
of multiple locations. The recorded pattern of the force–distance curve relies upon
several parameters like the tip, sample, and medium between tip and sample in
which force-distance curve is acquired. Further, there is a difference in curves of
samples obtained from the air and the liquid medium (fluid cell). Force-distance
curves acquired in air will be dominated by capillary forces. For the case of air as
medium, the cantilever gradually approaches towards the surface of sample, no significant deflection occurs due to the very small magnitude of the initial forces, which
further does not change the position of cantilever on the ordinate axis. During this
gradual approach, whenever the attractive forces (van der Waals and capillary forces)
between tip and sample exceeds the cantilever spring constant value, the deflection
in tip leads to jump into the contact with the surface. Once the tip is contacted to the
sample surface, it presses the surface of sample continuously, which results into the