

Ellipsometry Techniques and Its Advanced Applications …
575
is observed to have similar values of bulk silver. It is interesting to note that the imaginary part of ε y exhibits a strong absorption due to LSPR. Upon increasing the thickness of Ag-nanowires, their LSPR strength and wavelength increase due to increasing
fraction of Ag [44]. It should also be noted that the LSPR strength and LSPR wavelength for the imaginary part of ε y increase consistently with nanowire thickness as
compared to the ones for the imaginary part of ε x . The amplitude of the peak accounts
the potency of the LSPR absorption. Comparing the modelled Jones matrix elements
with experimentally measured ones within the accepted mean squared error (MSE),
provides the validity of the proposed model. However, extracting the simulated reflection or transmission spectrum from the fitted biaxial model and finding the difference
between the simulated and the measured spectrum within the error bar, confirms the
validity of proposed optical model. Therefore, transmission spectrum is measured for
ripples on SiO 2 substrate as the reflection cannot be measured in an absolute scale.
The electric field component along the long axis of silver nanowires undergoes a
transmission, however, it exhibits plasmonic resonance across the nanowires. Transmission spectrum is simulated by replacing the bottom layer with SiO 2 . Interestingly,
the extracted biaxial dielectric coefficients can be used to predict the transmission
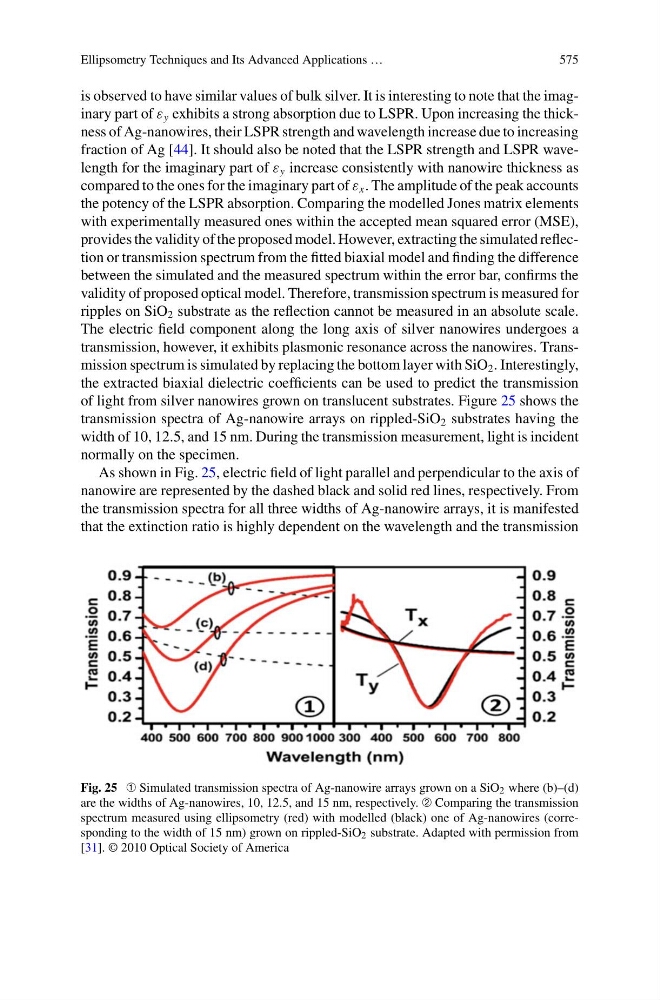
of light from silver nanowires grown on translucent substrates. Figure 25 shows the
transmission spectra of Ag-nanowire arrays on rippled-SiO 2 substrates having the
width of 10, 12.5, and 15 nm. During the transmission measurement, light is incident
normally on the specimen.
As shown in Fig. 25, electric field of light parallel and perpendicular to the axis of
nanowire are represented by the dashed black and solid red lines, respectively. From
the transmission spectra for all three widths of Ag-nanowire arrays, it is manifested
that the extinction ratio is highly dependent on the wavelength and the transmission
Fig. 25 ➀ Simulated transmission spectra of Ag-nanowire arrays grown on a SiO 2 where (b)–(d)
are the widths of Ag-nanowires, 10, 12.5, and 15 nm, respectively. ➁ Comparing the transmission
spectrum measured using ellipsometry (red) with modelled (black) one of Ag-nanowires (corresponding to the width of 15 nm) grown on rippled-SiO 2 substrate. Adapted with permission from
[31]. © 2010 Optical Society of America
575
is observed to have similar values of bulk silver. It is interesting to note that the imaginary part of ε y exhibits a strong absorption due to LSPR. Upon increasing the thickness of Ag-nanowires, their LSPR strength and wavelength increase due to increasing
fraction of Ag [44]. It should also be noted that the LSPR strength and LSPR wavelength for the imaginary part of ε y increase consistently with nanowire thickness as
compared to the ones for the imaginary part of ε x . The amplitude of the peak accounts
the potency of the LSPR absorption. Comparing the modelled Jones matrix elements
with experimentally measured ones within the accepted mean squared error (MSE),
provides the validity of the proposed model. However, extracting the simulated reflection or transmission spectrum from the fitted biaxial model and finding the difference
between the simulated and the measured spectrum within the error bar, confirms the
validity of proposed optical model. Therefore, transmission spectrum is measured for
ripples on SiO 2 substrate as the reflection cannot be measured in an absolute scale.
The electric field component along the long axis of silver nanowires undergoes a
transmission, however, it exhibits plasmonic resonance across the nanowires. Transmission spectrum is simulated by replacing the bottom layer with SiO 2 . Interestingly,
the extracted biaxial dielectric coefficients can be used to predict the transmission
of light from silver nanowires grown on translucent substrates. Figure 25 shows the
transmission spectra of Ag-nanowire arrays on rippled-SiO 2 substrates having the
width of 10, 12.5, and 15 nm. During the transmission measurement, light is incident
normally on the specimen.
As shown in Fig. 25, electric field of light parallel and perpendicular to the axis of
nanowire are represented by the dashed black and solid red lines, respectively. From
the transmission spectra for all three widths of Ag-nanowire arrays, it is manifested
that the extinction ratio is highly dependent on the wavelength and the transmission
Fig. 25 ➀ Simulated transmission spectra of Ag-nanowire arrays grown on a SiO 2 where (b)–(d)
are the widths of Ag-nanowires, 10, 12.5, and 15 nm, respectively. ➁ Comparing the transmission
spectrum measured using ellipsometry (red) with modelled (black) one of Ag-nanowires (corresponding to the width of 15 nm) grown on rippled-SiO 2 substrate. Adapted with permission from
[31]. © 2010 Optical Society of America