

532
N. Yadav and R. Dhar
3.1 Three-Dimensional Plotting of Data
Most often plots giving three-dimensional view are helpful since complete response
can be obtained on a single plot. It gives increased resolution over a wide range
of frequencies. Even the slightest error in the frequency points is clearly visible.
The utility of 3-D plots is that: (1) graphs of real and imaginary components can be
obtained as projections on the coordinate planes automatically, (2) a 3D perspective
of response can be seen and (3) graph in complex plane can be found. The real
and imaginary axes are replaced by their logarithms when there is extreme variation
in the quantity to be plotted. 3-D plots can be drawn in rectangular or polar form.
Chen and Cahan [53] have proposed the usefulness of projection plots of log |Z | vs.
frequency and phase angle vs. frequency. In most cases, rectangular and polar 3D
graphs are useful for examining, but the standard is rectangular plot having either
real or imaginary axes that indicates the entire response of function with respect to
frequency. However, the problem is which out of the four immittance functions, Z,
Y, M and ε should be drawn in 3D. The function which has been measured directly
should always be plotted. Apart from this, if all functions are drawn and analyzed,
then the one which displays the intricate details and covers a wide range of frequency
precisely should be given preference.
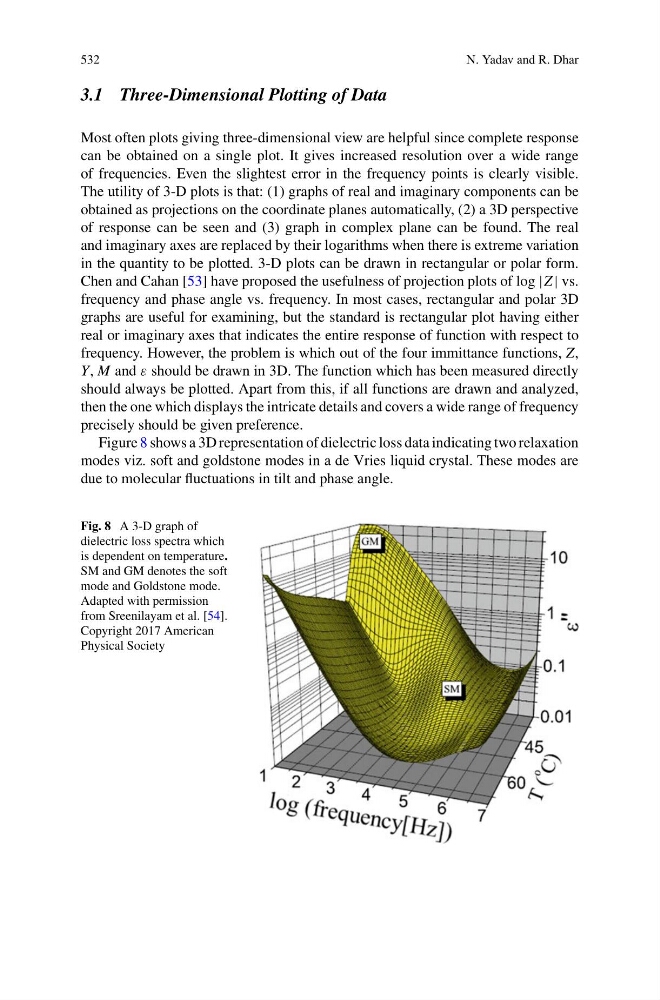
Figure 8 shows a 3D representation of dielectric loss data indicating two relaxation
modes viz. soft and goldstone modes in a de Vries liquid crystal. These modes are
due to molecular fluctuations in tilt and phase angle.
Fig. 8 A 3-D graph of
dielectric loss spectra which
is dependent on temperature.
SM and GM denotes the soft
mode and Goldstone mode.
Adapted with permission
from Sreenilayam et al. [54].
Copyright 2017 American
Physical Society
N. Yadav and R. Dhar
3.1 Three-Dimensional Plotting of Data
Most often plots giving three-dimensional view are helpful since complete response
can be obtained on a single plot. It gives increased resolution over a wide range
of frequencies. Even the slightest error in the frequency points is clearly visible.
The utility of 3-D plots is that: (1) graphs of real and imaginary components can be
obtained as projections on the coordinate planes automatically, (2) a 3D perspective
of response can be seen and (3) graph in complex plane can be found. The real
and imaginary axes are replaced by their logarithms when there is extreme variation
in the quantity to be plotted. 3-D plots can be drawn in rectangular or polar form.
Chen and Cahan [53] have proposed the usefulness of projection plots of log |Z | vs.
frequency and phase angle vs. frequency. In most cases, rectangular and polar 3D
graphs are useful for examining, but the standard is rectangular plot having either
real or imaginary axes that indicates the entire response of function with respect to
frequency. However, the problem is which out of the four immittance functions, Z,
Y, M and ε should be drawn in 3D. The function which has been measured directly
should always be plotted. Apart from this, if all functions are drawn and analyzed,
then the one which displays the intricate details and covers a wide range of frequency
precisely should be given preference.
Figure 8 shows a 3D representation of dielectric loss data indicating two relaxation
modes viz. soft and goldstone modes in a de Vries liquid crystal. These modes are
due to molecular fluctuations in tilt and phase angle.
Fig. 8 A 3-D graph of
dielectric loss spectra which
is dependent on temperature.
SM and GM denotes the soft
mode and Goldstone mode.
Adapted with permission
from Sreenilayam et al. [54].
Copyright 2017 American
Physical Society