

448
D. P. Singh et al.
• The absorbance is directly proportional to the length of the light path (l), which is
equal to the width of the cuvette.
On combining both assumptions, the absorbance (A), according to the Beer-Lambert
law can be written as:
A = log
I o
I
= .l.c
(19)
where, is known as the molar absorptivity or sometimes the molar absorption
coefficient, c is the concentration of the solution measured in mol L
−1 and l is the
length of the solution that light passes through it in cm.
2.2 Structure and Composition of Fluorescence
Spectrophotometer
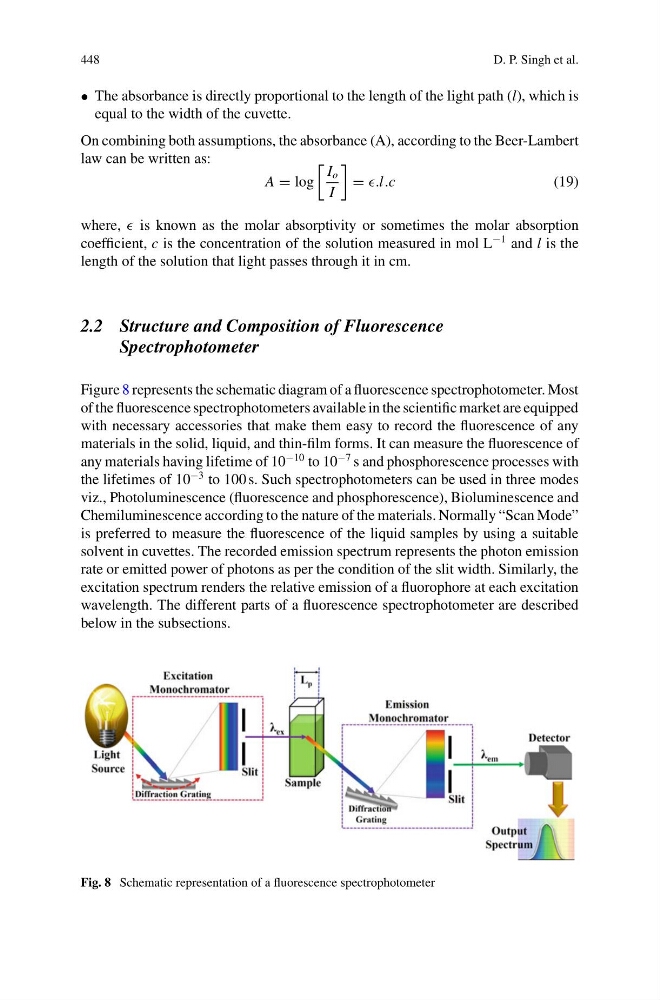
Figure 8 represents the schematic diagram of a fluorescence spectrophotometer. Most
of the fluorescence spectrophotometers available in the scientific market are equipped
with necessary accessories that make them easy to record the fluorescence of any
materials in the solid, liquid, and thin-film forms. It can measure the fluorescence of
any materials having lifetime of 10
−10 to 10
−7 s and phosphorescence processes with
the lifetimes of 10
−3 to 100 s. Such spectrophotometers can be used in three modes
viz., Photoluminescence (fluorescence and phosphorescence), Bioluminescence and
Chemiluminescence according to the nature of the materials. Normally “Scan Mode”
is preferred to measure the fluorescence of the liquid samples by using a suitable
solvent in cuvettes. The recorded emission spectrum represents the photon emission
rate or emitted power of photons as per the condition of the slit width. Similarly, the
excitation spectrum renders the relative emission of a fluorophore at each excitation
wavelength. The different parts of a fluorescence spectrophotometer are described
below in the subsections.
Fig. 8 Schematic representation of a fluorescence spectrophotometer
D. P. Singh et al.
• The absorbance is directly proportional to the length of the light path (l), which is
equal to the width of the cuvette.
On combining both assumptions, the absorbance (A), according to the Beer-Lambert
law can be written as:
A = log
I o
I
= .l.c
(19)
where, is known as the molar absorptivity or sometimes the molar absorption
coefficient, c is the concentration of the solution measured in mol L
−1 and l is the
length of the solution that light passes through it in cm.
2.2 Structure and Composition of Fluorescence
Spectrophotometer
Figure 8 represents the schematic diagram of a fluorescence spectrophotometer. Most
of the fluorescence spectrophotometers available in the scientific market are equipped
with necessary accessories that make them easy to record the fluorescence of any
materials in the solid, liquid, and thin-film forms. It can measure the fluorescence of
any materials having lifetime of 10
−10 to 10
−7 s and phosphorescence processes with
the lifetimes of 10
−3 to 100 s. Such spectrophotometers can be used in three modes
viz., Photoluminescence (fluorescence and phosphorescence), Bioluminescence and
Chemiluminescence according to the nature of the materials. Normally “Scan Mode”
is preferred to measure the fluorescence of the liquid samples by using a suitable
solvent in cuvettes. The recorded emission spectrum represents the photon emission
rate or emitted power of photons as per the condition of the slit width. Similarly, the
excitation spectrum renders the relative emission of a fluorophore at each excitation
wavelength. The different parts of a fluorescence spectrophotometer are described
below in the subsections.
Fig. 8 Schematic representation of a fluorescence spectrophotometer