

Application of X-Ray Photoelectron Spectroscopy in Materials …
417
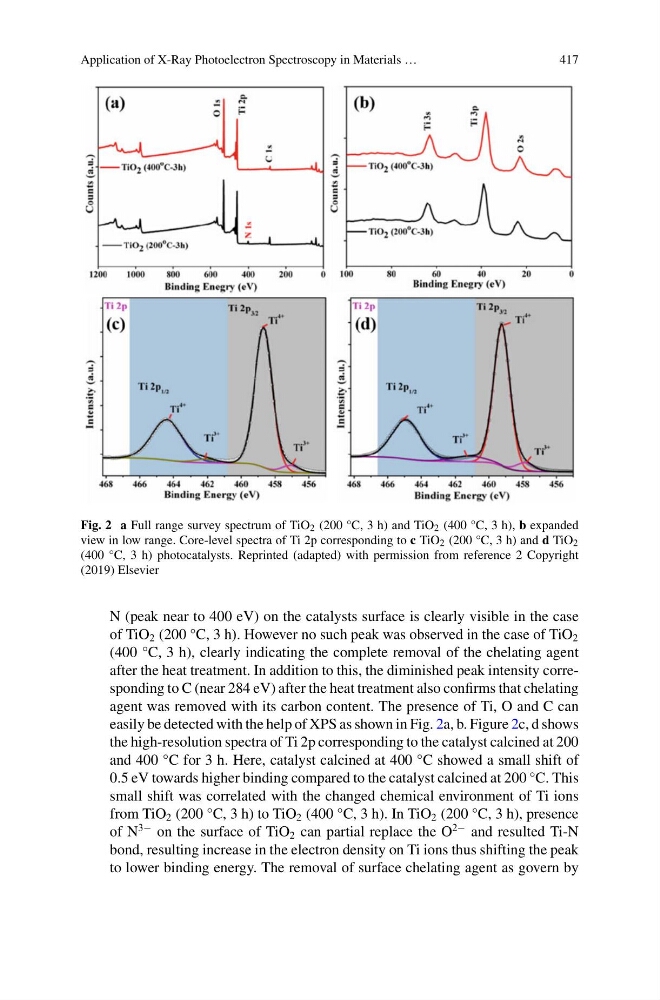
Fig. 2 a Full range survey spectrum of TiO 2 (200 °C, 3 h) and TiO 2 (400 °C, 3 h), b expanded
view in low range. Core-level spectra of Ti 2p corresponding to c TiO 2 (200 °C, 3 h) and d TiO 2
(400 °C, 3 h) photocatalysts. Reprinted (adapted) with permission from reference 2 Copyright
(2019) Elsevier
N (peak near to 400 eV) on the catalysts surface is clearly visible in the case
of TiO 2 (200 °C, 3 h). However no such peak was observed in the case of TiO 2
(400 °C, 3 h), clearly indicating the complete removal of the chelating agent
after the heat treatment. In addition to this, the diminished peak intensity corresponding to C (near 284 eV) after the heat treatment also confirms that chelating
agent was removed with its carbon content. The presence of Ti, O and C can
easily be detected with the help of XPS as shown in Fig. 2a, b. Figure 2c, d shows
the high-resolution spectra of Ti 2p corresponding to the catalyst calcined at 200
and 400 °C for 3 h. Here, catalyst calcined at 400 °C showed a small shift of
0.5 eV towards higher binding compared to the catalyst calcined at 200 °C. This
small shift was correlated with the changed chemical environment of Ti ions
from TiO 2 (200 °C, 3 h) to TiO 2 (400 °C, 3 h). In TiO 2 (200 °C, 3 h), presence
of N
3− on the surface of TiO 2 can partial replace the O
2− and resulted Ti-N
bond, resulting increase in the electron density on Ti ions thus shifting the peak
to lower binding energy. The removal of surface chelating agent as govern by
417
Fig. 2 a Full range survey spectrum of TiO 2 (200 °C, 3 h) and TiO 2 (400 °C, 3 h), b expanded
view in low range. Core-level spectra of Ti 2p corresponding to c TiO 2 (200 °C, 3 h) and d TiO 2
(400 °C, 3 h) photocatalysts. Reprinted (adapted) with permission from reference 2 Copyright
(2019) Elsevier
N (peak near to 400 eV) on the catalysts surface is clearly visible in the case
of TiO 2 (200 °C, 3 h). However no such peak was observed in the case of TiO 2
(400 °C, 3 h), clearly indicating the complete removal of the chelating agent
after the heat treatment. In addition to this, the diminished peak intensity corresponding to C (near 284 eV) after the heat treatment also confirms that chelating
agent was removed with its carbon content. The presence of Ti, O and C can
easily be detected with the help of XPS as shown in Fig. 2a, b. Figure 2c, d shows
the high-resolution spectra of Ti 2p corresponding to the catalyst calcined at 200
and 400 °C for 3 h. Here, catalyst calcined at 400 °C showed a small shift of
0.5 eV towards higher binding compared to the catalyst calcined at 200 °C. This
small shift was correlated with the changed chemical environment of Ti ions
from TiO 2 (200 °C, 3 h) to TiO 2 (400 °C, 3 h). In TiO 2 (200 °C, 3 h), presence
of N
3− on the surface of TiO 2 can partial replace the O
2− and resulted Ti-N
bond, resulting increase in the electron density on Ti ions thus shifting the peak
to lower binding energy. The removal of surface chelating agent as govern by