

404
P. Singh et al.
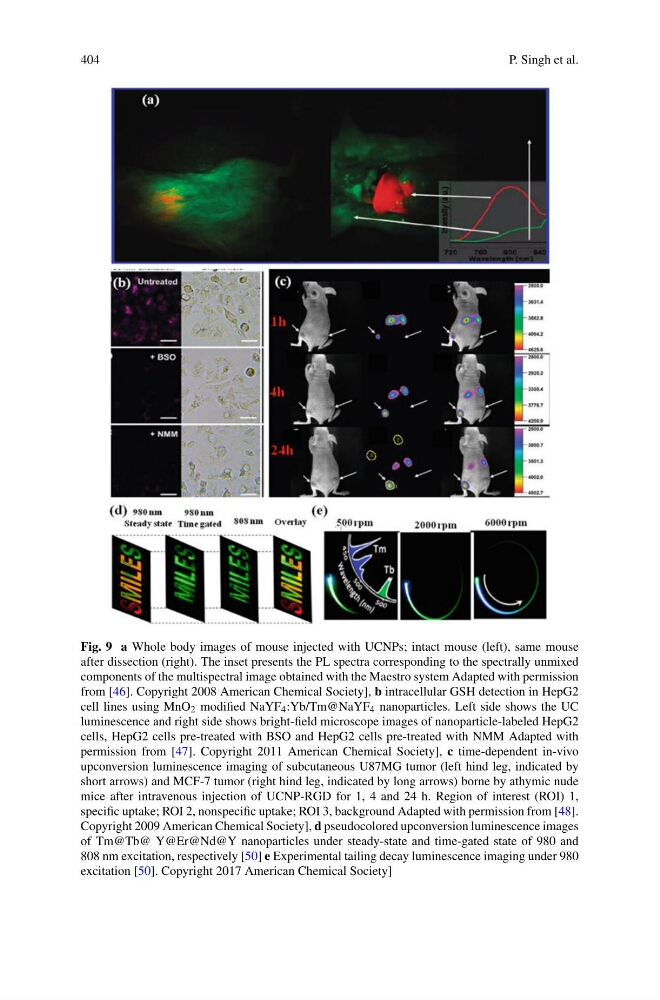
Fig. 9 a Whole body images of mouse injected with UCNPs; intact mouse (left), same mouse
after dissection (right). The inset presents the PL spectra corresponding to the spectrally unmixed
components of the multispectral image obtained with the Maestro system Adapted with permission
from [46]. Copyright 2008 American Chemical Society], b intracellular GSH detection in HepG2
cell lines using MnO 2 modified NaYF 4 :Yb/Tm@NaYF 4 nanoparticles. Left side shows the UC
luminescence and right side shows bright-field microscope images of nanoparticle-labeled HepG2
cells, HepG2 cells pre-treated with BSO and HepG2 cells pre-treated with NMM Adapted with
permission from [47]. Copyright 2011 American Chemical Society], c time-dependent in-vivo
upconversion luminescence imaging of subcutaneous U87MG tumor (left hind leg, indicated by
short arrows) and MCF-7 tumor (right hind leg, indicated by long arrows) borne by athymic nude
mice after intravenous injection of UCNP-RGD for 1, 4 and 24 h. Region of interest (ROI) 1,
specific uptake; ROI 2, nonspecific uptake; ROI 3, background Adapted with permission from [48].
Copyright 2009 American Chemical Society], d pseudocolored upconversion luminescence images
of Tm@Tb@ Y@Er@Nd@Y nanoparticles under steady-state and time-gated state of 980 and
808 nm excitation, respectively [50] e Experimental tailing decay luminescence imaging under 980
excitation [50]. Copyright 2017 American Chemical Society]
P. Singh et al.
Fig. 9 a Whole body images of mouse injected with UCNPs; intact mouse (left), same mouse
after dissection (right). The inset presents the PL spectra corresponding to the spectrally unmixed
components of the multispectral image obtained with the Maestro system Adapted with permission
from [46]. Copyright 2008 American Chemical Society], b intracellular GSH detection in HepG2
cell lines using MnO 2 modified NaYF 4 :Yb/Tm@NaYF 4 nanoparticles. Left side shows the UC
luminescence and right side shows bright-field microscope images of nanoparticle-labeled HepG2
cells, HepG2 cells pre-treated with BSO and HepG2 cells pre-treated with NMM Adapted with
permission from [47]. Copyright 2011 American Chemical Society], c time-dependent in-vivo
upconversion luminescence imaging of subcutaneous U87MG tumor (left hind leg, indicated by
short arrows) and MCF-7 tumor (right hind leg, indicated by long arrows) borne by athymic nude
mice after intravenous injection of UCNP-RGD for 1, 4 and 24 h. Region of interest (ROI) 1,
specific uptake; ROI 2, nonspecific uptake; ROI 3, background Adapted with permission from [48].
Copyright 2009 American Chemical Society], d pseudocolored upconversion luminescence images
of Tm@Tb@ Y@Er@Nd@Y nanoparticles under steady-state and time-gated state of 980 and
808 nm excitation, respectively [50] e Experimental tailing decay luminescence imaging under 980
excitation [50]. Copyright 2017 American Chemical Society]