

354
A. L. Chakraborty and A. Roy
and ψ 1 for 2f WMS). The ratios I /I 1 , I /I 2 and I 1 /I 2 are time-invariant system
parameters although I , I 1 and I 2 individually show considerable variation. The
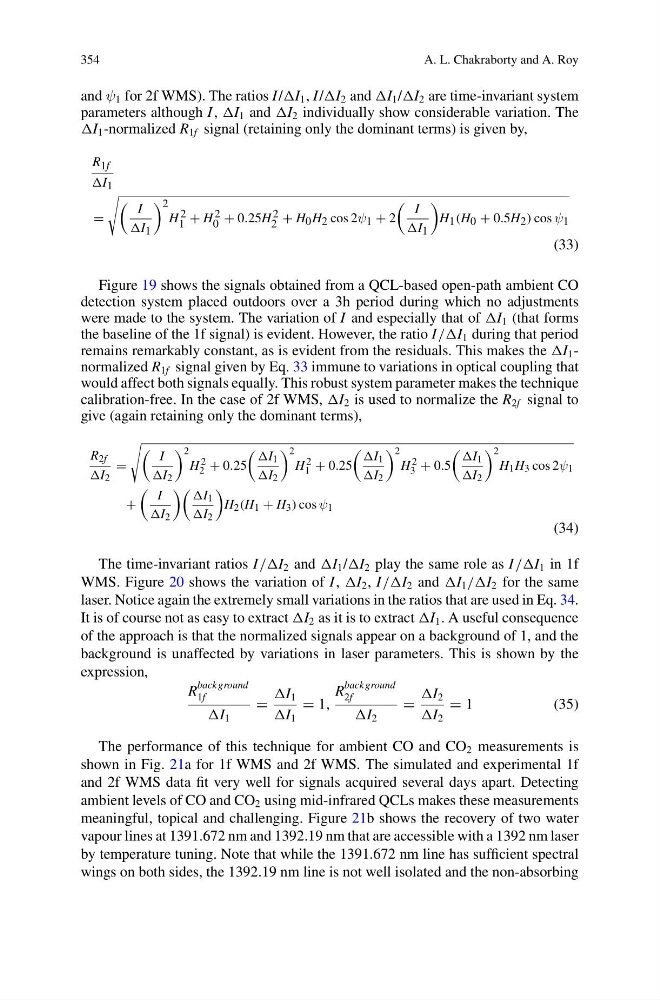
I 1 -normalized R 1f signal (retaining only the dominant terms) is given by,
R 1f
I 1
=
I
I 1
2
H 2
1 + H 2
0 + 0.25H 2
2 + H 0 H 2 cos 2ψ 1 + 2
I
I 1
H 1 (H 0 + 0.5H 2 ) cos ψ 1
(33)
Figure 19 shows the signals obtained from a QCL-based open-path ambient CO
detection system placed outdoors over a 3h period during which no adjustments
were made to the system. The variation of I and especially that of I 1 (that forms
the baseline of the 1f signal) is evident. However, the ratio I //I 1 during that period
remains remarkably constant, as is evident from the residuals. This makes the I 1 -
normalized R 1f signal given by Eq. 33 immune to variations in optical coupling that
would affect both signals equally. This robust system parameter makes the technique
calibration-free. In the case of 2f WMS, I 2 is used to normalize the R 2f signal to
give (again retaining only the dominant terms),
R 2f
I 2
=
I
I 2
2
H 2
2 + 0.25
I 1
I 2
2
H 2
1 + 0.25
I 1
I 2
2
H 2
3 + 0.5
I 1
I 2
2
H 1 H 3 cos 2ψ 1
+
I
I 2
I 1
I 2
H 2 (H 1 + H 3 ) cos ψ 1
(34)
The time-invariant ratios I //I 2 and I 1 /I 2 play the same role as I //I 1 in 1f
WMS. Figure 20 shows the variation of I , I 2 , I //I 2 and I 1 //I 2 for the same
laser. Notice again the extremely small variations in the ratios that are used in Eq. 34.
It is of course not as easy to extract I 2 as it is to extract I 1 . A useful consequence
of the approach is that the normalized signals appear on a background of 1, and the
background is unaffected by variations in laser parameters. This is shown by the
expression,
R
background
1f
I 1
=
I 1
I 1
= 1,
R
background
2f
I 2
=
I 2
I 2
= 1
(35)
The performance of this technique for ambient CO and CO 2 measurements is
shown in Fig. 21a for 1f WMS and 2f WMS. The simulated and experimental 1f
and 2f WMS data fit very well for signals acquired several days apart. Detecting
ambient levels of CO and CO 2 using mid-infrared QCLs makes these measurements
meaningful, topical and challenging. Figure 21b shows the recovery of two water
vapour lines at 1391.672 nm and 1392.19 nm that are accessible with a 1392 nm laser
by temperature tuning. Note that while the 1391.672 nm line has sufficient spectral
wings on both sides, the 1392.19 nm line is not well isolated and the non-absorbing
A. L. Chakraborty and A. Roy
and ψ 1 for 2f WMS). The ratios I /I 1 , I /I 2 and I 1 /I 2 are time-invariant system
parameters although I , I 1 and I 2 individually show considerable variation. The
I 1 -normalized R 1f signal (retaining only the dominant terms) is given by,
R 1f
I 1
=
I
I 1
2
H 2
1 + H 2
0 + 0.25H 2
2 + H 0 H 2 cos 2ψ 1 + 2
I
I 1
H 1 (H 0 + 0.5H 2 ) cos ψ 1
(33)
Figure 19 shows the signals obtained from a QCL-based open-path ambient CO
detection system placed outdoors over a 3h period during which no adjustments
were made to the system. The variation of I and especially that of I 1 (that forms
the baseline of the 1f signal) is evident. However, the ratio I //I 1 during that period
remains remarkably constant, as is evident from the residuals. This makes the I 1 -
normalized R 1f signal given by Eq. 33 immune to variations in optical coupling that
would affect both signals equally. This robust system parameter makes the technique
calibration-free. In the case of 2f WMS, I 2 is used to normalize the R 2f signal to
give (again retaining only the dominant terms),
R 2f
I 2
=
I
I 2
2
H 2
2 + 0.25
I 1
I 2
2
H 2
1 + 0.25
I 1
I 2
2
H 2
3 + 0.5
I 1
I 2
2
H 1 H 3 cos 2ψ 1
+
I
I 2
I 1
I 2
H 2 (H 1 + H 3 ) cos ψ 1
(34)
The time-invariant ratios I //I 2 and I 1 /I 2 play the same role as I //I 1 in 1f
WMS. Figure 20 shows the variation of I , I 2 , I //I 2 and I 1 //I 2 for the same
laser. Notice again the extremely small variations in the ratios that are used in Eq. 34.
It is of course not as easy to extract I 2 as it is to extract I 1 . A useful consequence
of the approach is that the normalized signals appear on a background of 1, and the
background is unaffected by variations in laser parameters. This is shown by the
expression,
R
background
1f
I 1
=
I 1
I 1
= 1,
R
background
2f
I 2
=
I 2
I 2
= 1
(35)
The performance of this technique for ambient CO and CO 2 measurements is
shown in Fig. 21a for 1f WMS and 2f WMS. The simulated and experimental 1f
and 2f WMS data fit very well for signals acquired several days apart. Detecting
ambient levels of CO and CO 2 using mid-infrared QCLs makes these measurements
meaningful, topical and challenging. Figure 21b shows the recovery of two water
vapour lines at 1391.672 nm and 1392.19 nm that are accessible with a 1392 nm laser
by temperature tuning. Note that while the 1391.672 nm line has sufficient spectral
wings on both sides, the 1392.19 nm line is not well isolated and the non-absorbing