

Wavelength Modulation Spectroscopy
353
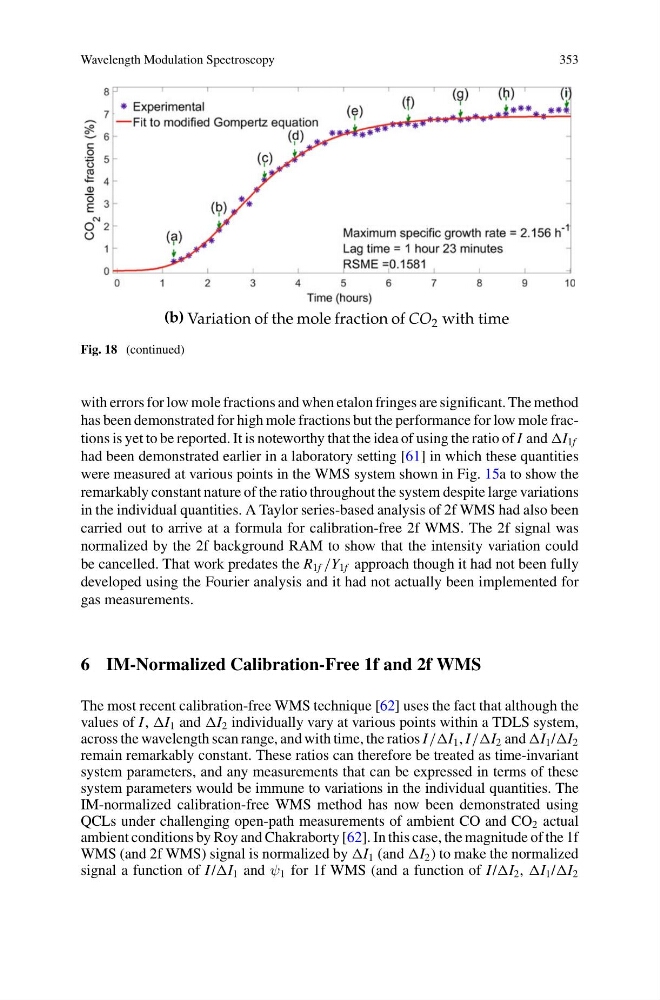
Fig. 18 (continued)
with errors for low mole fractions and when etalon fringes are significant. The method
has been demonstrated for high mole fractions but the performance for low mole fractions is yet to be reported. It is noteworthy that the idea of using the ratio of I and 1f
had been demonstrated earlier in a laboratory setting [61] in which these quantities
were measured at various points in the WMS system shown in Fig. 15a to show the
remarkably constant nature of the ratio throughout the system despite large variations
in the individual quantities. A Taylor series-based analysis of 2f WMS had also been
carried out to arrive at a formula for calibration-free 2f WMS. The 2f signal was
normalized by the 2f background RAM to show that the intensity variation could
be cancelled. That work predates the R 1f /Y 1f approach though it had not been fully
developed using the Fourier analysis and it had not actually been implemented for
gas measurements.
6 IM-Normalized Calibration-Free 1f and 2f WMS
The most recent calibration-free WMS technique [62] uses the fact that although the
values of I , 1 and 2 individually vary at various points within a TDLS system,
across the wavelength scan range, and with time, the ratios I //I 1 , I //I 2 and 1 / 2
remain remarkably constant. These ratios can therefore be treated as time-invariant
system parameters, and any measurements that can be expressed in terms of these
system parameters would be immune to variations in the individual quantities. The
IM-normalized calibration-free WMS method has now been demonstrated using
QCLs under challenging open-path measurements of ambient CO and CO 2 actual
ambient conditions by Roy and Chakraborty [62]. In this case, the magnitude of the 1f
WMS (and 2f WMS) signal is normalized by 1 (and 2 ) to make the normalized
signal a function of I / 1 and ψ 1 for 1f WMS (and a function of I / 2 , 1 / 2
353
Fig. 18 (continued)
with errors for low mole fractions and when etalon fringes are significant. The method
has been demonstrated for high mole fractions but the performance for low mole fractions is yet to be reported. It is noteworthy that the idea of using the ratio of I and 1f
had been demonstrated earlier in a laboratory setting [61] in which these quantities
were measured at various points in the WMS system shown in Fig. 15a to show the
remarkably constant nature of the ratio throughout the system despite large variations
in the individual quantities. A Taylor series-based analysis of 2f WMS had also been
carried out to arrive at a formula for calibration-free 2f WMS. The 2f signal was
normalized by the 2f background RAM to show that the intensity variation could
be cancelled. That work predates the R 1f /Y 1f approach though it had not been fully
developed using the Fourier analysis and it had not actually been implemented for
gas measurements.
6 IM-Normalized Calibration-Free 1f and 2f WMS
The most recent calibration-free WMS technique [62] uses the fact that although the
values of I , 1 and 2 individually vary at various points within a TDLS system,
across the wavelength scan range, and with time, the ratios I //I 1 , I //I 2 and 1 / 2
remain remarkably constant. These ratios can therefore be treated as time-invariant
system parameters, and any measurements that can be expressed in terms of these
system parameters would be immune to variations in the individual quantities. The
IM-normalized calibration-free WMS method has now been demonstrated using
QCLs under challenging open-path measurements of ambient CO and CO 2 actual
ambient conditions by Roy and Chakraborty [62]. In this case, the magnitude of the 1f
WMS (and 2f WMS) signal is normalized by 1 (and 2 ) to make the normalized
signal a function of I / 1 and ψ 1 for 1f WMS (and a function of I / 2 , 1 / 2