

346
A. L. Chakraborty and A. Roy
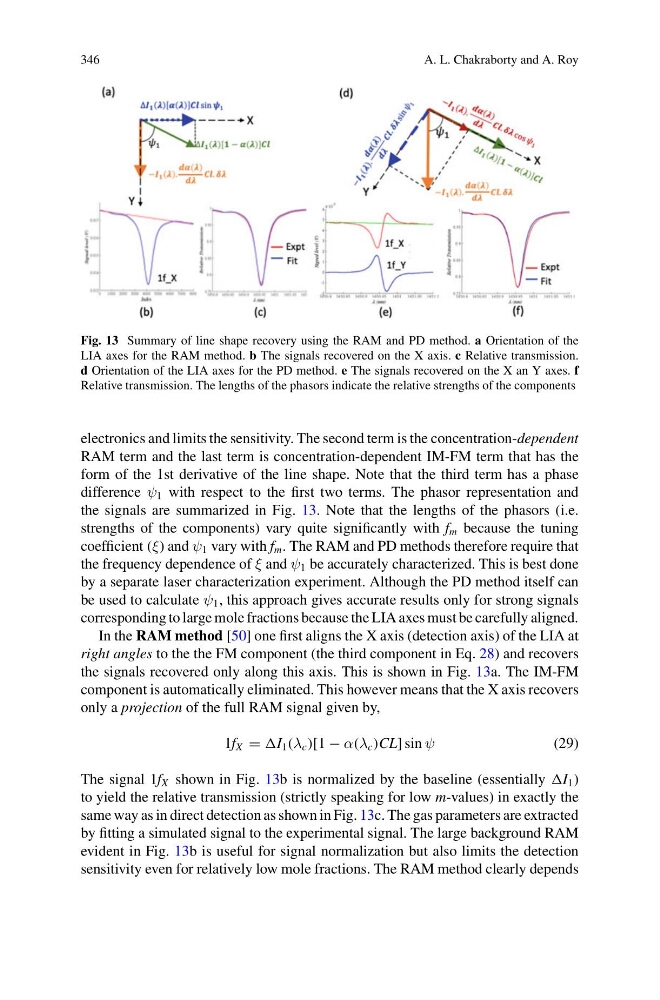
Fig. 13 Summary of line shape recovery using the RAM and PD method. a Orientation of the
LIA axes for the RAM method. b The signals recovered on the X axis. c Relative transmission.
d Orientation of the LIA axes for the PD method. e The signals recovered on the X an Y axes. f
Relative transmission. The lengths of the phasors indicate the relative strengths of the components
electronics and limits the sensitivity. The second term is the concentration-dependent
RAM term and the last term is concentration-dependent IM-FM term that has the
form of the 1st derivative of the line shape. Note that the third term has a phase
difference ψ 1 with respect to the first two terms. The phasor representation and
the signals are summarized in Fig. 13. Note that the lengths of the phasors (i.e.
strengths of the components) vary quite significantly with f m because the tuning
coefficient (ξ) and ψ 1 vary with f m . The RAM and PD methods therefore require that
the frequency dependence of ξ and ψ 1 be accurately characterized. This is best done
by a separate laser characterization experiment. Although the PD method itself can
be used to calculate ψ 1 , this approach gives accurate results only for strong signals
corresponding to large mole fractions because the LIA axes must be carefully aligned.
In the RAM method [50] one first aligns the X axis (detection axis) of the LIA at
right angles to the the FM component (the third component in Eq. 28) and recovers
the signals recovered only along this axis. This is shown in Fig. 13a. The IM-FM
component is automatically eliminated. This however means that the X axis recovers
only a projection of the full RAM signal given by,
1f X = I 1 (λ c )[1 − α(λ c )CL] sin ψ
(29)
The signal 1f X shown in Fig. 13b is normalized by the baseline (essentially I 1 )
to yield the relative transmission (strictly speaking for low m-values) in exactly the
same way as in direct detection as shown in Fig. 13c. The gas parameters are extracted
by fitting a simulated signal to the experimental signal. The large background RAM
evident in Fig. 13b is useful for signal normalization but also limits the detection
sensitivity even for relatively low mole fractions. The RAM method clearly depends
A. L. Chakraborty and A. Roy
Fig. 13 Summary of line shape recovery using the RAM and PD method. a Orientation of the
LIA axes for the RAM method. b The signals recovered on the X axis. c Relative transmission.
d Orientation of the LIA axes for the PD method. e The signals recovered on the X an Y axes. f
Relative transmission. The lengths of the phasors indicate the relative strengths of the components
electronics and limits the sensitivity. The second term is the concentration-dependent
RAM term and the last term is concentration-dependent IM-FM term that has the
form of the 1st derivative of the line shape. Note that the third term has a phase
difference ψ 1 with respect to the first two terms. The phasor representation and
the signals are summarized in Fig. 13. Note that the lengths of the phasors (i.e.
strengths of the components) vary quite significantly with f m because the tuning
coefficient (ξ) and ψ 1 vary with f m . The RAM and PD methods therefore require that
the frequency dependence of ξ and ψ 1 be accurately characterized. This is best done
by a separate laser characterization experiment. Although the PD method itself can
be used to calculate ψ 1 , this approach gives accurate results only for strong signals
corresponding to large mole fractions because the LIA axes must be carefully aligned.
In the RAM method [50] one first aligns the X axis (detection axis) of the LIA at
right angles to the the FM component (the third component in Eq. 28) and recovers
the signals recovered only along this axis. This is shown in Fig. 13a. The IM-FM
component is automatically eliminated. This however means that the X axis recovers
only a projection of the full RAM signal given by,
1f X = I 1 (λ c )[1 − α(λ c )CL] sin ψ
(29)
The signal 1f X shown in Fig. 13b is normalized by the baseline (essentially I 1 )
to yield the relative transmission (strictly speaking for low m-values) in exactly the
same way as in direct detection as shown in Fig. 13c. The gas parameters are extracted
by fitting a simulated signal to the experimental signal. The large background RAM
evident in Fig. 13b is useful for signal normalization but also limits the detection
sensitivity even for relatively low mole fractions. The RAM method clearly depends