

Wavelength Modulation Spectroscopy
331
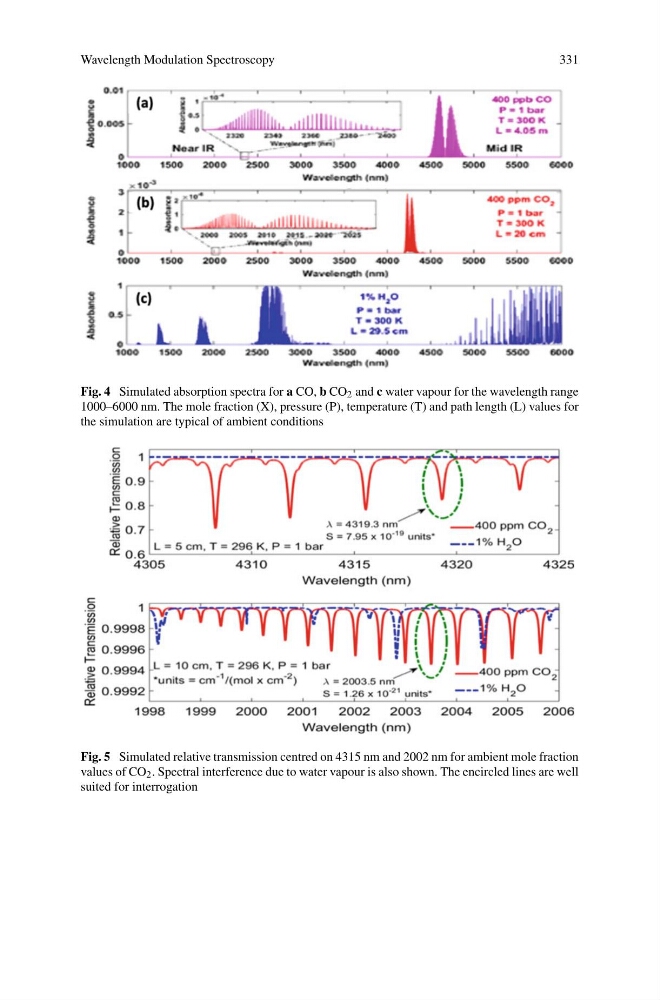
Fig. 4 Simulated absorption spectra for a CO, b CO 2 and c water vapour for the wavelength range
1000–6000 nm. The mole fraction (X), pressure (P), temperature (T) and path length (L) values for
the simulation are typical of ambient conditions
Fig. 5 Simulated relative transmission centred on 4315 nm and 2002 nm for ambient mole fraction
values of CO 2 . Spectral interference due to water vapour is also shown. The encircled lines are well
suited for interrogation
331
Fig. 4 Simulated absorption spectra for a CO, b CO 2 and c water vapour for the wavelength range
1000–6000 nm. The mole fraction (X), pressure (P), temperature (T) and path length (L) values for
the simulation are typical of ambient conditions
Fig. 5 Simulated relative transmission centred on 4315 nm and 2002 nm for ambient mole fraction
values of CO 2 . Spectral interference due to water vapour is also shown. The encircled lines are well
suited for interrogation