

326
A. L. Chakraborty and A. Roy
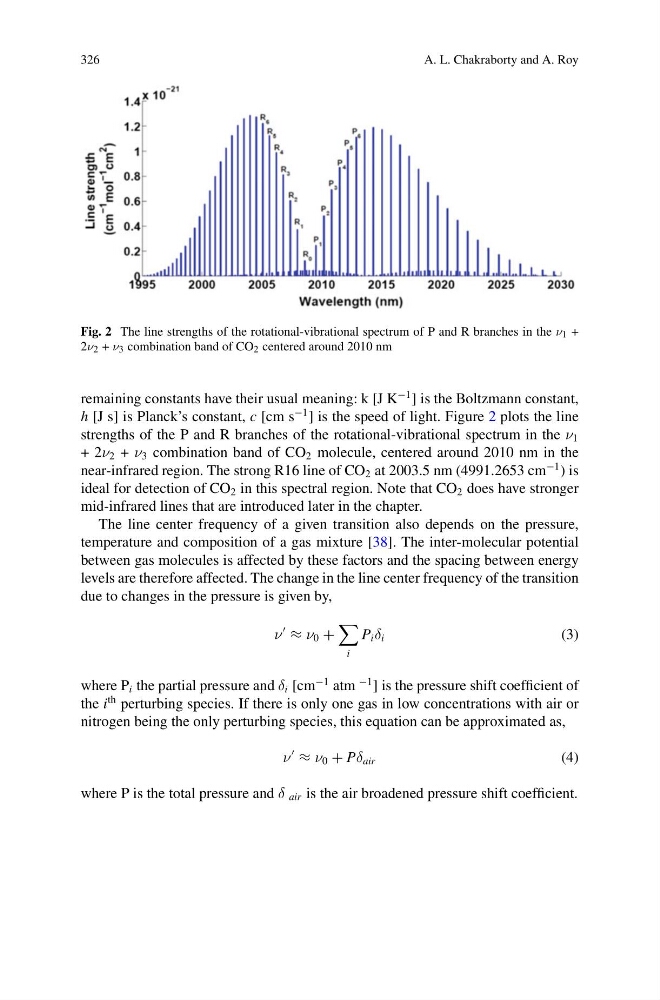
Fig. 2 The line strengths of the rotational-vibrational spectrum of P and R branches in the ν 1 +
2ν 2 + ν 3 combination band of CO 2 centered around 2010 nm
remaining constants have their usual meaning: k [J K
−1 ] is the Boltzmann constant,
h [J s] is Planck’s constant, c [cm s
−1 ] is the speed of light. Figure 2 plots the line
strengths of the P and R branches of the rotational-vibrational spectrum in the ν 1
+ 2ν 2 + ν 3 combination band of CO 2 molecule, centered around 2010 nm in the
near-infrared region. The strong R16 line of CO 2 at 2003.5 nm (4991.2653 cm
−1 ) is
ideal for detection of CO 2 in this spectral region. Note that CO 2 does have stronger
mid-infrared lines that are introduced later in the chapter.
The line center frequency of a given transition also depends on the pressure,
temperature and composition of a gas mixture [38]. The inter-molecular potential
between gas molecules is affected by these factors and the spacing between energy
levels are therefore affected. The change in the line center frequency of the transition
due to changes in the pressure is given by,
ν
≈ ν 0 +
i
P i δ i
(3)
where P i the partial pressure and δ i [cm
−1 atm
−1 ] is the pressure shift coefficient of
the i
th perturbing species. If there is only one gas in low concentrations with air or
nitrogen being the only perturbing species, this equation can be approximated as,
ν
≈ ν 0 + Pδ air
(4)
where P is the total pressure and δ air is the air broadened pressure shift coefficient.
A. L. Chakraborty and A. Roy
Fig. 2 The line strengths of the rotational-vibrational spectrum of P and R branches in the ν 1 +
2ν 2 + ν 3 combination band of CO 2 centered around 2010 nm
remaining constants have their usual meaning: k [J K
−1 ] is the Boltzmann constant,
h [J s] is Planck’s constant, c [cm s
−1 ] is the speed of light. Figure 2 plots the line
strengths of the P and R branches of the rotational-vibrational spectrum in the ν 1
+ 2ν 2 + ν 3 combination band of CO 2 molecule, centered around 2010 nm in the
near-infrared region. The strong R16 line of CO 2 at 2003.5 nm (4991.2653 cm
−1 ) is
ideal for detection of CO 2 in this spectral region. Note that CO 2 does have stronger
mid-infrared lines that are introduced later in the chapter.
The line center frequency of a given transition also depends on the pressure,
temperature and composition of a gas mixture [38]. The inter-molecular potential
between gas molecules is affected by these factors and the spacing between energy
levels are therefore affected. The change in the line center frequency of the transition
due to changes in the pressure is given by,
ν
≈ ν 0 +
i
P i δ i
(3)
where P i the partial pressure and δ i [cm
−1 atm
−1 ] is the pressure shift coefficient of
the i
th perturbing species. If there is only one gas in low concentrations with air or
nitrogen being the only perturbing species, this equation can be approximated as,
ν
≈ ν 0 + Pδ air
(4)
where P is the total pressure and δ air is the air broadened pressure shift coefficient.