

280
P. Madhusudhan et al.
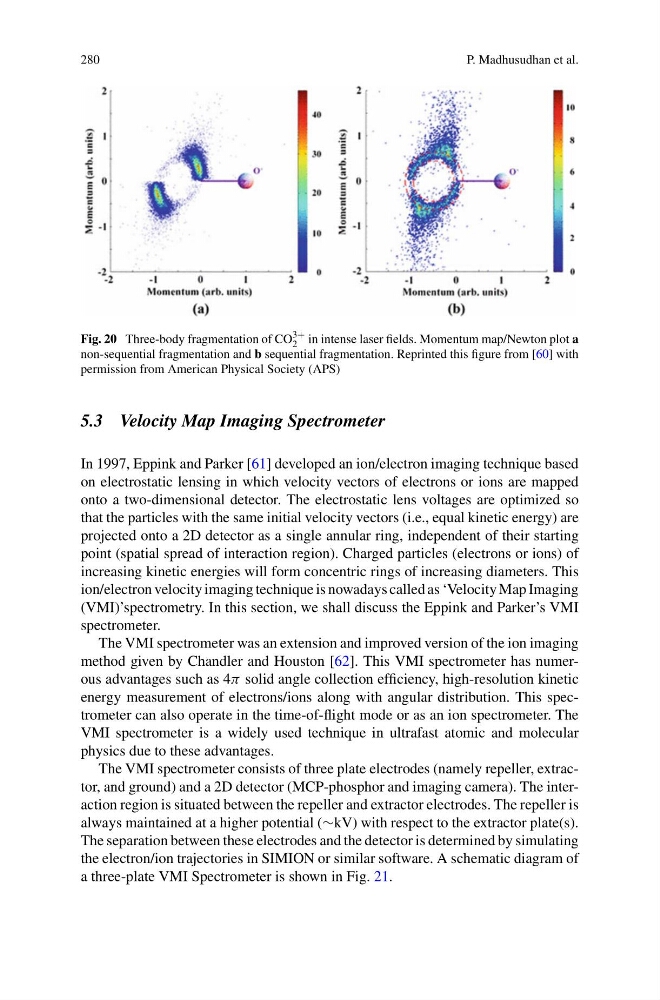
Fig. 20 Three-body fragmentation of CO
3+
2 in intense laser fields. Momentum map/Newton plot a
non-sequential fragmentation and b sequential fragmentation. Reprinted this figure from [60] with
permission from American Physical Society (APS)
5.3 Velocity Map Imaging Spectrometer
In 1997, Eppink and Parker [61] developed an ion/electron imaging technique based
on electrostatic lensing in which velocity vectors of electrons or ions are mapped
onto a two-dimensional detector. The electrostatic lens voltages are optimized so
that the particles with the same initial velocity vectors (i.e., equal kinetic energy) are
projected onto a 2D detector as a single annular ring, independent of their starting
point (spatial spread of interaction region). Charged particles (electrons or ions) of
increasing kinetic energies will form concentric rings of increasing diameters. This
ion/electron velocity imaging technique is nowadays called as ‘Velocity Map Imaging
(VMI)’spectrometry. In this section, we shall discuss the Eppink and Parker’s VMI
spectrometer.
The VMI spectrometer was an extension and improved version of the ion imaging
method given by Chandler and Houston [62]. This VMI spectrometer has numerous advantages such as 4π solid angle collection efficiency, high-resolution kinetic
energy measurement of electrons/ions along with angular distribution. This spectrometer can also operate in the time-of-flight mode or as an ion spectrometer. The
VMI spectrometer is a widely used technique in ultrafast atomic and molecular
physics due to these advantages.
The VMI spectrometer consists of three plate electrodes (namely repeller, extractor, and ground) and a 2D detector (MCP-phosphor and imaging camera). The interaction region is situated between the repeller and extractor electrodes. The repeller is
always maintained at a higher potential (∼kV) with respect to the extractor plate(s).
The separation between these electrodes and the detector is determined by simulating
the electron/ion trajectories in SIMION or similar software. A schematic diagram of
a three-plate VMI Spectrometer is shown in Fig. 21.
P. Madhusudhan et al.
Fig. 20 Three-body fragmentation of CO
3+
2 in intense laser fields. Momentum map/Newton plot a
non-sequential fragmentation and b sequential fragmentation. Reprinted this figure from [60] with
permission from American Physical Society (APS)
5.3 Velocity Map Imaging Spectrometer
In 1997, Eppink and Parker [61] developed an ion/electron imaging technique based
on electrostatic lensing in which velocity vectors of electrons or ions are mapped
onto a two-dimensional detector. The electrostatic lens voltages are optimized so
that the particles with the same initial velocity vectors (i.e., equal kinetic energy) are
projected onto a 2D detector as a single annular ring, independent of their starting
point (spatial spread of interaction region). Charged particles (electrons or ions) of
increasing kinetic energies will form concentric rings of increasing diameters. This
ion/electron velocity imaging technique is nowadays called as ‘Velocity Map Imaging
(VMI)’spectrometry. In this section, we shall discuss the Eppink and Parker’s VMI
spectrometer.
The VMI spectrometer was an extension and improved version of the ion imaging
method given by Chandler and Houston [62]. This VMI spectrometer has numerous advantages such as 4π solid angle collection efficiency, high-resolution kinetic
energy measurement of electrons/ions along with angular distribution. This spectrometer can also operate in the time-of-flight mode or as an ion spectrometer. The
VMI spectrometer is a widely used technique in ultrafast atomic and molecular
physics due to these advantages.
The VMI spectrometer consists of three plate electrodes (namely repeller, extractor, and ground) and a 2D detector (MCP-phosphor and imaging camera). The interaction region is situated between the repeller and extractor electrodes. The repeller is
always maintained at a higher potential (∼kV) with respect to the extractor plate(s).
The separation between these electrodes and the detector is determined by simulating
the electron/ion trajectories in SIMION or similar software. A schematic diagram of
a three-plate VMI Spectrometer is shown in Fig. 21.