

Fundamentals of ATR-FTIR Spectroscopy and Its Role …
13
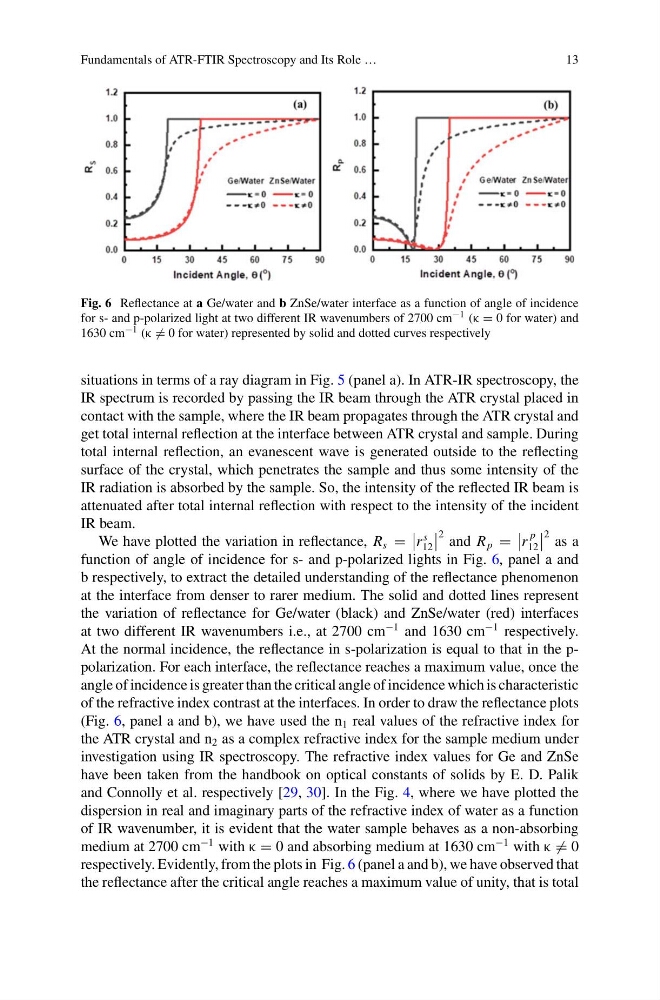
Fig. 6 Reflectance at a Ge/water and b ZnSe/water interface as a function of angle of incidence
for s- and p-polarized light at two different IR wavenumbers of 2700 cm −1 (κ = 0 for water) and
1630 cm −1 (κ = 0 for water) represented by solid and dotted curves respectively
situations in terms of a ray diagram in Fig. 5 (panel a). In ATR-IR spectroscopy, the
IR spectrum is recorded by passing the IR beam through the ATR crystal placed in
contact with the sample, where the IR beam propagates through the ATR crystal and
get total internal reflection at the interface between ATR crystal and sample. During
total internal reflection, an evanescent wave is generated outside to the reflecting
surface of the crystal, which penetrates the sample and thus some intensity of the
IR radiation is absorbed by the sample. So, the intensity of the reflected IR beam is
attenuated after total internal reflection with respect to the intensity of the incident
IR beam.
We have plotted the variation in reflectance, R s =
r
s
12
2 and R p =
r
p
12
2 as a
function of angle of incidence for s- and p-polarized lights in Fig. 6, panel a and
b respectively, to extract the detailed understanding of the reflectance phenomenon
at the interface from denser to rarer medium. The solid and dotted lines represent
the variation of reflectance for Ge/water (black) and ZnSe/water (red) interfaces
at two different IR wavenumbers i.e., at 2700 cm
−1 and 1630 cm
−1 respectively.
At the normal incidence, the reflectance in s-polarization is equal to that in the ppolarization. For each interface, the reflectance reaches a maximum value, once the
angle of incidence is greater than the critical angle of incidence which is characteristic
of the refractive index contrast at the interfaces. In order to draw the reflectance plots
(Fig. 6, panel a and b), we have used the n 1 real values of the refractive index for
the ATR crystal and n 2 as a complex refractive index for the sample medium under
investigation using IR spectroscopy. The refractive index values for Ge and ZnSe
have been taken from the handbook on optical constants of solids by E. D. Palik
and Connolly et al. respectively [29, 30]. In the Fig. 4, where we have plotted the
dispersion in real and imaginary parts of the refractive index of water as a function
of IR wavenumber, it is evident that the water sample behaves as a non-absorbing
medium at 2700 cm
−1 with κ = 0 and absorbing medium at 1630 cm
−1 with κ = 0
respectively. Evidently, from the plots in Fig. 6 (panel a and b), we have observed that
the reflectance after the critical angle reaches a maximum value of unity, that is total
13
Fig. 6 Reflectance at a Ge/water and b ZnSe/water interface as a function of angle of incidence
for s- and p-polarized light at two different IR wavenumbers of 2700 cm −1 (κ = 0 for water) and
1630 cm −1 (κ = 0 for water) represented by solid and dotted curves respectively
situations in terms of a ray diagram in Fig. 5 (panel a). In ATR-IR spectroscopy, the
IR spectrum is recorded by passing the IR beam through the ATR crystal placed in
contact with the sample, where the IR beam propagates through the ATR crystal and
get total internal reflection at the interface between ATR crystal and sample. During
total internal reflection, an evanescent wave is generated outside to the reflecting
surface of the crystal, which penetrates the sample and thus some intensity of the
IR radiation is absorbed by the sample. So, the intensity of the reflected IR beam is
attenuated after total internal reflection with respect to the intensity of the incident
IR beam.
We have plotted the variation in reflectance, R s =
r
s
12
2 and R p =
r
p
12
2 as a
function of angle of incidence for s- and p-polarized lights in Fig. 6, panel a and
b respectively, to extract the detailed understanding of the reflectance phenomenon
at the interface from denser to rarer medium. The solid and dotted lines represent
the variation of reflectance for Ge/water (black) and ZnSe/water (red) interfaces
at two different IR wavenumbers i.e., at 2700 cm
−1 and 1630 cm
−1 respectively.
At the normal incidence, the reflectance in s-polarization is equal to that in the ppolarization. For each interface, the reflectance reaches a maximum value, once the
angle of incidence is greater than the critical angle of incidence which is characteristic
of the refractive index contrast at the interfaces. In order to draw the reflectance plots
(Fig. 6, panel a and b), we have used the n 1 real values of the refractive index for
the ATR crystal and n 2 as a complex refractive index for the sample medium under
investigation using IR spectroscopy. The refractive index values for Ge and ZnSe
have been taken from the handbook on optical constants of solids by E. D. Palik
and Connolly et al. respectively [29, 30]. In the Fig. 4, where we have plotted the
dispersion in real and imaginary parts of the refractive index of water as a function
of IR wavenumber, it is evident that the water sample behaves as a non-absorbing
medium at 2700 cm
−1 with κ = 0 and absorbing medium at 1630 cm
−1 with κ = 0
respectively. Evidently, from the plots in Fig. 6 (panel a and b), we have observed that
the reflectance after the critical angle reaches a maximum value of unity, that is total