

246
A. Mazaheri Tehrani et al.
function of time. These authors have successfully shown the transfer of vibrational
energy to the modes beyond the excitation spectrum due to interionic interactions.
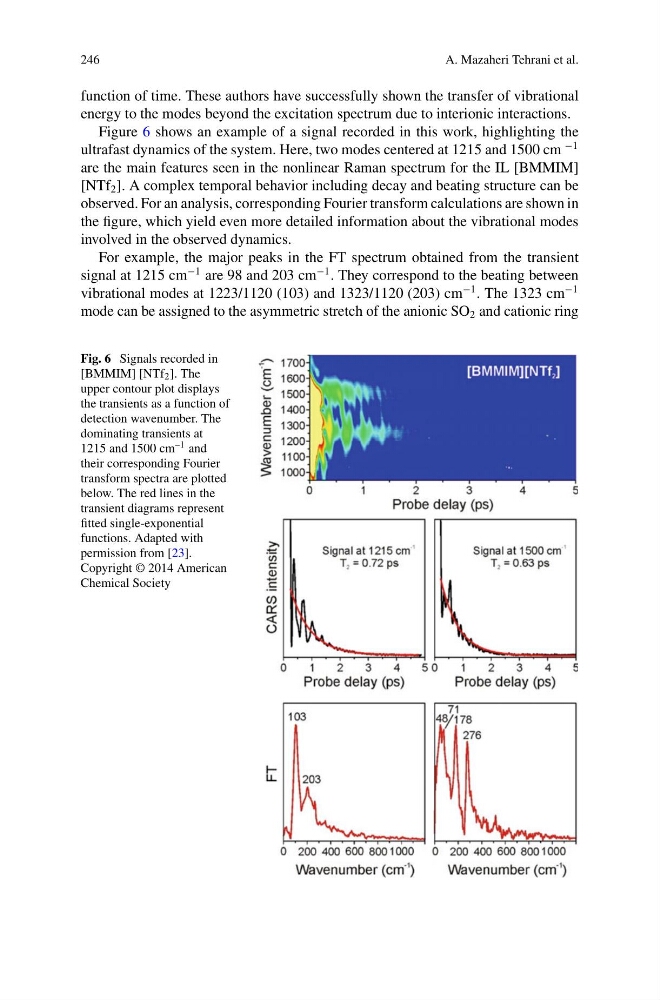
Figure 6 shows an example of a signal recorded in this work, highlighting the
ultrafast dynamics of the system. Here, two modes centered at 1215 and 1500 cm
−1
are the main features seen in the nonlinear Raman spectrum for the IL [BMMIM]
[NTf 2 ]. A complex temporal behavior including decay and beating structure can be
observed. For an analysis, corresponding Fourier transform calculations are shown in
the figure, which yield even more detailed information about the vibrational modes
involved in the observed dynamics.
For example, the major peaks in the FT spectrum obtained from the transient
signal at 1215 cm
−1 are 98 and 203 cm
−1 . They correspond to the beating between
vibrational modes at 1223/1120 (103) and 1323/1120 (203) cm
−1 . The 1323 cm
−1
mode can be assigned to the asymmetric stretch of the anionic SO 2 and cationic ring
Fig. 6 Signals recorded in
[BMMIM] [NTf 2 ]. The
upper contour plot displays
the transients as a function of
detection wavenumber. The
dominating transients at
1215 and 1500 cm –1 and
their corresponding Fourier
transform spectra are plotted
below. The red lines in the
transient diagrams represent
fitted single-exponential
functions. Adapted with
permission from [23].
Copyright © 2014 American
Chemical Society
A. Mazaheri Tehrani et al.
function of time. These authors have successfully shown the transfer of vibrational
energy to the modes beyond the excitation spectrum due to interionic interactions.
Figure 6 shows an example of a signal recorded in this work, highlighting the
ultrafast dynamics of the system. Here, two modes centered at 1215 and 1500 cm
−1
are the main features seen in the nonlinear Raman spectrum for the IL [BMMIM]
[NTf 2 ]. A complex temporal behavior including decay and beating structure can be
observed. For an analysis, corresponding Fourier transform calculations are shown in
the figure, which yield even more detailed information about the vibrational modes
involved in the observed dynamics.
For example, the major peaks in the FT spectrum obtained from the transient
signal at 1215 cm
−1 are 98 and 203 cm
−1 . They correspond to the beating between
vibrational modes at 1223/1120 (103) and 1323/1120 (203) cm
−1 . The 1323 cm
−1
mode can be assigned to the asymmetric stretch of the anionic SO 2 and cationic ring
Fig. 6 Signals recorded in
[BMMIM] [NTf 2 ]. The
upper contour plot displays
the transients as a function of
detection wavenumber. The
dominating transients at
1215 and 1500 cm –1 and
their corresponding Fourier
transform spectra are plotted
below. The red lines in the
transient diagrams represent
fitted single-exponential
functions. Adapted with
permission from [23].
Copyright © 2014 American
Chemical Society