

Tip-Enhanced Raman Spectroscopy
227
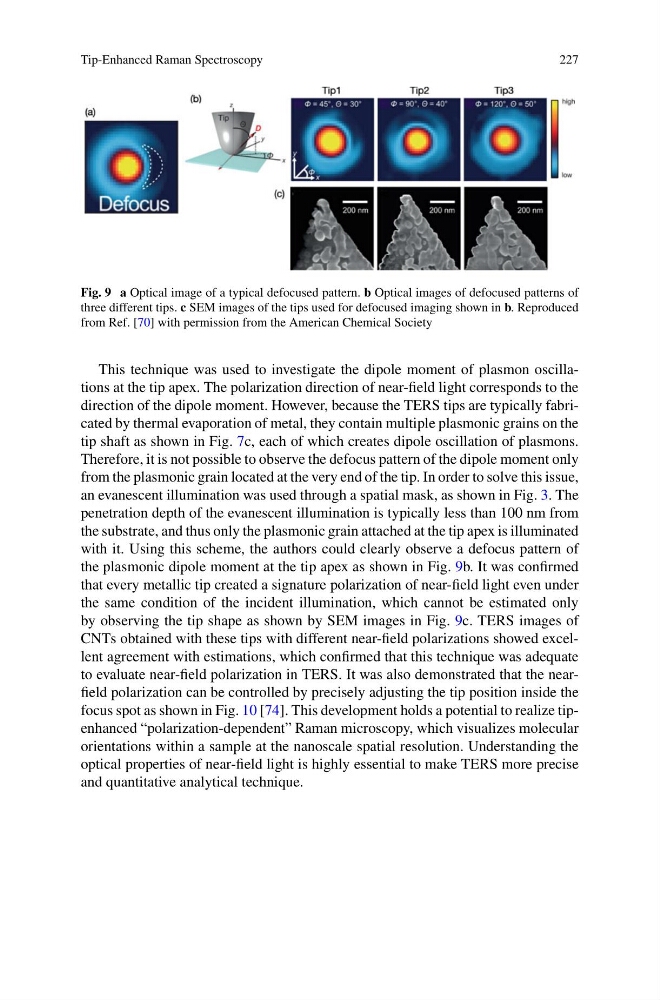
Fig. 9 a Optical image of a typical defocused pattern. b Optical images of defocused patterns of
three different tips. c SEM images of the tips used for defocused imaging shown in b. Reproduced
from Ref. [70] with permission from the American Chemical Society
This technique was used to investigate the dipole moment of plasmon oscillations at the tip apex. The polarization direction of near-field light corresponds to the
direction of the dipole moment. However, because the TERS tips are typically fabricated by thermal evaporation of metal, they contain multiple plasmonic grains on the
tip shaft as shown in Fig. 7c, each of which creates dipole oscillation of plasmons.
Therefore, it is not possible to observe the defocus pattern of the dipole moment only
from the plasmonic grain located at the very end of the tip. In order to solve this issue,
an evanescent illumination was used through a spatial mask, as shown in Fig. 3. The
penetration depth of the evanescent illumination is typically less than 100 nm from
the substrate, and thus only the plasmonic grain attached at the tip apex is illuminated
with it. Using this scheme, the authors could clearly observe a defocus pattern of
the plasmonic dipole moment at the tip apex as shown in Fig. 9b. It was confirmed
that every metallic tip created a signature polarization of near-field light even under
the same condition of the incident illumination, which cannot be estimated only
by observing the tip shape as shown by SEM images in Fig. 9c. TERS images of
CNTs obtained with these tips with different near-field polarizations showed excellent agreement with estimations, which confirmed that this technique was adequate
to evaluate near-field polarization in TERS. It was also demonstrated that the nearfield polarization can be controlled by precisely adjusting the tip position inside the
focus spot as shown in Fig. 10 [74]. This development holds a potential to realize tipenhanced “polarization-dependent” Raman microscopy, which visualizes molecular
orientations within a sample at the nanoscale spatial resolution. Understanding the
optical properties of near-field light is highly essential to make TERS more precise
and quantitative analytical technique.
227
Fig. 9 a Optical image of a typical defocused pattern. b Optical images of defocused patterns of
three different tips. c SEM images of the tips used for defocused imaging shown in b. Reproduced
from Ref. [70] with permission from the American Chemical Society
This technique was used to investigate the dipole moment of plasmon oscillations at the tip apex. The polarization direction of near-field light corresponds to the
direction of the dipole moment. However, because the TERS tips are typically fabricated by thermal evaporation of metal, they contain multiple plasmonic grains on the
tip shaft as shown in Fig. 7c, each of which creates dipole oscillation of plasmons.
Therefore, it is not possible to observe the defocus pattern of the dipole moment only
from the plasmonic grain located at the very end of the tip. In order to solve this issue,
an evanescent illumination was used through a spatial mask, as shown in Fig. 3. The
penetration depth of the evanescent illumination is typically less than 100 nm from
the substrate, and thus only the plasmonic grain attached at the tip apex is illuminated
with it. Using this scheme, the authors could clearly observe a defocus pattern of
the plasmonic dipole moment at the tip apex as shown in Fig. 9b. It was confirmed
that every metallic tip created a signature polarization of near-field light even under
the same condition of the incident illumination, which cannot be estimated only
by observing the tip shape as shown by SEM images in Fig. 9c. TERS images of
CNTs obtained with these tips with different near-field polarizations showed excellent agreement with estimations, which confirmed that this technique was adequate
to evaluate near-field polarization in TERS. It was also demonstrated that the nearfield polarization can be controlled by precisely adjusting the tip position inside the
focus spot as shown in Fig. 10 [74]. This development holds a potential to realize tipenhanced “polarization-dependent” Raman microscopy, which visualizes molecular
orientations within a sample at the nanoscale spatial resolution. Understanding the
optical properties of near-field light is highly essential to make TERS more precise
and quantitative analytical technique.