

224
T. Umakoshi and P. Verma
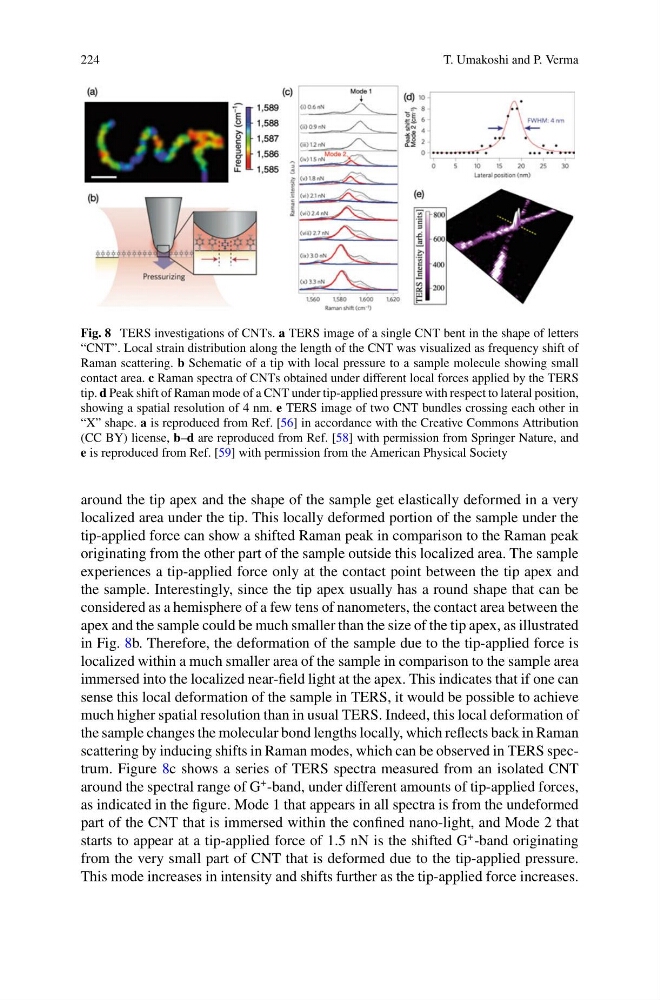
Fig. 8 TERS investigations of CNTs. a TERS image of a single CNT bent in the shape of letters
“CNT”. Local strain distribution along the length of the CNT was visualized as frequency shift of
Raman scattering. b Schematic of a tip with local pressure to a sample molecule showing small
contact area. c Raman spectra of CNTs obtained under different local forces applied by the TERS
tip. d Peak shift of Raman mode of a CNT under tip-applied pressure with respect to lateral position,
showing a spatial resolution of 4 nm. e TERS image of two CNT bundles crossing each other in
“X” shape. a is reproduced from Ref. [56] in accordance with the Creative Commons Attribution
(CC BY) license, b–d are reproduced from Ref. [58] with permission from Springer Nature, and
e is reproduced from Ref. [59] with permission from the American Physical Society
around the tip apex and the shape of the sample get elastically deformed in a very
localized area under the tip. This locally deformed portion of the sample under the
tip-applied force can show a shifted Raman peak in comparison to the Raman peak
originating from the other part of the sample outside this localized area. The sample
experiences a tip-applied force only at the contact point between the tip apex and
the sample. Interestingly, since the tip apex usually has a round shape that can be
considered as a hemisphere of a few tens of nanometers, the contact area between the
apex and the sample could be much smaller than the size of the tip apex, as illustrated
in Fig. 8b. Therefore, the deformation of the sample due to the tip-applied force is
localized within a much smaller area of the sample in comparison to the sample area
immersed into the localized near-field light at the apex. This indicates that if one can
sense this local deformation of the sample in TERS, it would be possible to achieve
much higher spatial resolution than in usual TERS. Indeed, this local deformation of
the sample changes the molecular bond lengths locally, which reflects back in Raman
scattering by inducing shifts in Raman modes, which can be observed in TERS spectrum. Figure 8c shows a series of TERS spectra measured from an isolated CNT
around the spectral range of G
+ -band, under different amounts of tip-applied forces,
as indicated in the figure. Mode 1 that appears in all spectra is from the undeformed
part of the CNT that is immersed within the confined nano-light, and Mode 2 that
starts to appear at a tip-applied force of 1.5 nN is the shifted G
+ -band originating
from the very small part of CNT that is deformed due to the tip-applied pressure.
This mode increases in intensity and shifts further as the tip-applied force increases.
T. Umakoshi and P. Verma
Fig. 8 TERS investigations of CNTs. a TERS image of a single CNT bent in the shape of letters
“CNT”. Local strain distribution along the length of the CNT was visualized as frequency shift of
Raman scattering. b Schematic of a tip with local pressure to a sample molecule showing small
contact area. c Raman spectra of CNTs obtained under different local forces applied by the TERS
tip. d Peak shift of Raman mode of a CNT under tip-applied pressure with respect to lateral position,
showing a spatial resolution of 4 nm. e TERS image of two CNT bundles crossing each other in
“X” shape. a is reproduced from Ref. [56] in accordance with the Creative Commons Attribution
(CC BY) license, b–d are reproduced from Ref. [58] with permission from Springer Nature, and
e is reproduced from Ref. [59] with permission from the American Physical Society
around the tip apex and the shape of the sample get elastically deformed in a very
localized area under the tip. This locally deformed portion of the sample under the
tip-applied force can show a shifted Raman peak in comparison to the Raman peak
originating from the other part of the sample outside this localized area. The sample
experiences a tip-applied force only at the contact point between the tip apex and
the sample. Interestingly, since the tip apex usually has a round shape that can be
considered as a hemisphere of a few tens of nanometers, the contact area between the
apex and the sample could be much smaller than the size of the tip apex, as illustrated
in Fig. 8b. Therefore, the deformation of the sample due to the tip-applied force is
localized within a much smaller area of the sample in comparison to the sample area
immersed into the localized near-field light at the apex. This indicates that if one can
sense this local deformation of the sample in TERS, it would be possible to achieve
much higher spatial resolution than in usual TERS. Indeed, this local deformation of
the sample changes the molecular bond lengths locally, which reflects back in Raman
scattering by inducing shifts in Raman modes, which can be observed in TERS spectrum. Figure 8c shows a series of TERS spectra measured from an isolated CNT
around the spectral range of G
+ -band, under different amounts of tip-applied forces,
as indicated in the figure. Mode 1 that appears in all spectra is from the undeformed
part of the CNT that is immersed within the confined nano-light, and Mode 2 that
starts to appear at a tip-applied force of 1.5 nN is the shifted G
+ -band originating
from the very small part of CNT that is deformed due to the tip-applied pressure.
This mode increases in intensity and shifts further as the tip-applied force increases.