

Tip-Enhanced Raman Spectroscopy
223
intensity decrease of Raman peaks. Figure 8a shows a TERS image of an isolated
single-walled CNT, which was manipulated into the shape of the letters “CNT” [57].
A straight CNT was bent from several locations along its length in a controlled
fashion so that it took the desired shape of “CNT”, which was created by pushing
and dragging the CNT from different locations with the sharp end of an AFM tip.
During this dragging process, the CNT was locally elongated and rolled as it bent
into the desired shape. This created some tensile and torsional strain along the length
of the CNT. Therefore, a local variation in the Raman shift of the G
+ -band was
expected along the CNT, which would represent the kind and the amount of local
strain. In order to visualize these local strains along the length of the CNT, a TERS
image shown in Fig. 8a was plotted by the Raman peak position of G
+ -band, which
is expected to shift depending on the kind and the amount of the strain. It is known
that the peak position of G
+ -band shifts to higher frequency if there is a torsional
strain, whereas it shifts to lower frequency under a tensile strain. The peak-shift is
color-coded in Fig. 8a, thus the color variation in TERS image shows how local strain
varied within a single CNT along its length. As seen in the image, local strain within
a CNT was clearly analyzed with the nanoscale spatial resolution.
Figure 8a showed a beautiful example of how an AFM tip can be used to manipulate a particular physical property of the sample, such as the local strain within
a CNT, by pushing the sample laterally by the tip apex, and then the same tip can
be used in TERS to study this physical property at the nanoscale after coating it
with a plasmonic metal. Another interesting application of tip to modify a physical
property of a sample by a probe tip is when one applies a tiny pressure or force on
the sample by pushing it with the tip apex in the vertical direction [58–60]. This
can be done even with a metal-coated tip used for TERS measurement. In contrast
to the previous case, when the sample is pushed in the vertical direction rather than
in the lateral direction, the sample is sandwiched between the substrate and the tip
apex. Therefore, instead of developing a local strain, it undergoes a local pressure
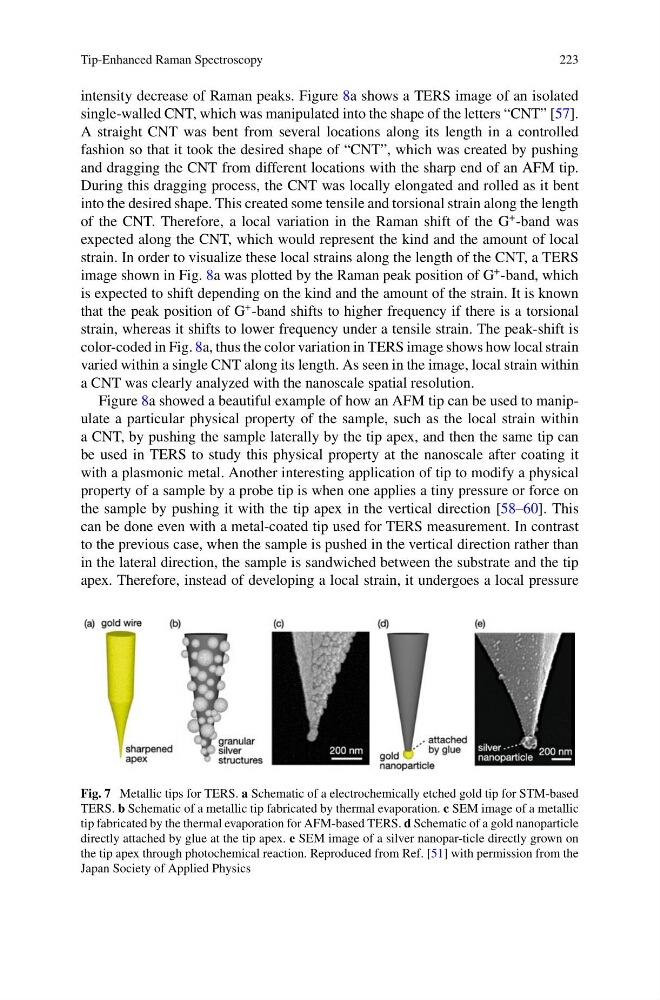
Fig. 7 Metallic tips for TERS. a Schematic of a electrochemically etched gold tip for STM-based
TERS. b Schematic of a metallic tip fabricated by thermal evaporation. c SEM image of a metallic
tip fabricated by the thermal evaporation for AFM-based TERS. d Schematic of a gold nanoparticle
directly attached by glue at the tip apex. e SEM image of a silver nanopar-ticle directly grown on
the tip apex through photochemical reaction. Reproduced from Ref. [51] with permission from the
Japan Society of Applied Physics
223
intensity decrease of Raman peaks. Figure 8a shows a TERS image of an isolated
single-walled CNT, which was manipulated into the shape of the letters “CNT” [57].
A straight CNT was bent from several locations along its length in a controlled
fashion so that it took the desired shape of “CNT”, which was created by pushing
and dragging the CNT from different locations with the sharp end of an AFM tip.
During this dragging process, the CNT was locally elongated and rolled as it bent
into the desired shape. This created some tensile and torsional strain along the length
of the CNT. Therefore, a local variation in the Raman shift of the G
+ -band was
expected along the CNT, which would represent the kind and the amount of local
strain. In order to visualize these local strains along the length of the CNT, a TERS
image shown in Fig. 8a was plotted by the Raman peak position of G
+ -band, which
is expected to shift depending on the kind and the amount of the strain. It is known
that the peak position of G
+ -band shifts to higher frequency if there is a torsional
strain, whereas it shifts to lower frequency under a tensile strain. The peak-shift is
color-coded in Fig. 8a, thus the color variation in TERS image shows how local strain
varied within a single CNT along its length. As seen in the image, local strain within
a CNT was clearly analyzed with the nanoscale spatial resolution.
Figure 8a showed a beautiful example of how an AFM tip can be used to manipulate a particular physical property of the sample, such as the local strain within
a CNT, by pushing the sample laterally by the tip apex, and then the same tip can
be used in TERS to study this physical property at the nanoscale after coating it
with a plasmonic metal. Another interesting application of tip to modify a physical
property of a sample by a probe tip is when one applies a tiny pressure or force on
the sample by pushing it with the tip apex in the vertical direction [58–60]. This
can be done even with a metal-coated tip used for TERS measurement. In contrast
to the previous case, when the sample is pushed in the vertical direction rather than
in the lateral direction, the sample is sandwiched between the substrate and the tip
apex. Therefore, instead of developing a local strain, it undergoes a local pressure
Fig. 7 Metallic tips for TERS. a Schematic of a electrochemically etched gold tip for STM-based
TERS. b Schematic of a metallic tip fabricated by thermal evaporation. c SEM image of a metallic
tip fabricated by the thermal evaporation for AFM-based TERS. d Schematic of a gold nanoparticle
directly attached by glue at the tip apex. e SEM image of a silver nanopar-ticle directly grown on
the tip apex through photochemical reaction. Reproduced from Ref. [51] with permission from the
Japan Society of Applied Physics