

214
T. Umakoshi and P. Verma
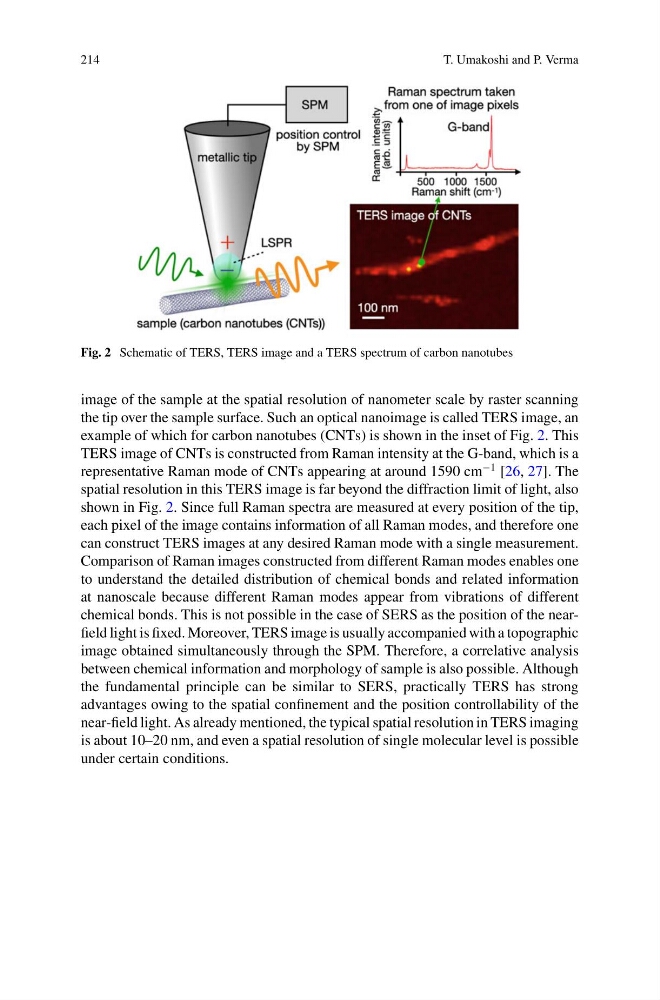
Fig. 2 Schematic of TERS, TERS image and a TERS spectrum of carbon nanotubes
image of the sample at the spatial resolution of nanometer scale by raster scanning
the tip over the sample surface. Such an optical nanoimage is called TERS image, an
example of which for carbon nanotubes (CNTs) is shown in the inset of Fig. 2. This
TERS image of CNTs is constructed from Raman intensity at the G-band, which is a
representative Raman mode of CNTs appearing at around 1590 cm
−1 [26, 27]. The
spatial resolution in this TERS image is far beyond the diffraction limit of light, also
shown in Fig. 2. Since full Raman spectra are measured at every position of the tip,
each pixel of the image contains information of all Raman modes, and therefore one
can construct TERS images at any desired Raman mode with a single measurement.
Comparison of Raman images constructed from different Raman modes enables one
to understand the detailed distribution of chemical bonds and related information
at nanoscale because different Raman modes appear from vibrations of different
chemical bonds. This is not possible in the case of SERS as the position of the nearfield light is fixed. Moreover, TERS image is usually accompanied with a topographic
image obtained simultaneously through the SPM. Therefore, a correlative analysis
between chemical information and morphology of sample is also possible. Although
the fundamental principle can be similar to SERS, practically TERS has strong
advantages owing to the spatial confinement and the position controllability of the
near-field light. As already mentioned, the typical spatial resolution in TERS imaging
is about 10–20 nm, and even a spatial resolution of single molecular level is possible
under certain conditions.
T. Umakoshi and P. Verma
Fig. 2 Schematic of TERS, TERS image and a TERS spectrum of carbon nanotubes
image of the sample at the spatial resolution of nanometer scale by raster scanning
the tip over the sample surface. Such an optical nanoimage is called TERS image, an
example of which for carbon nanotubes (CNTs) is shown in the inset of Fig. 2. This
TERS image of CNTs is constructed from Raman intensity at the G-band, which is a
representative Raman mode of CNTs appearing at around 1590 cm
−1 [26, 27]. The
spatial resolution in this TERS image is far beyond the diffraction limit of light, also
shown in Fig. 2. Since full Raman spectra are measured at every position of the tip,
each pixel of the image contains information of all Raman modes, and therefore one
can construct TERS images at any desired Raman mode with a single measurement.
Comparison of Raman images constructed from different Raman modes enables one
to understand the detailed distribution of chemical bonds and related information
at nanoscale because different Raman modes appear from vibrations of different
chemical bonds. This is not possible in the case of SERS as the position of the nearfield light is fixed. Moreover, TERS image is usually accompanied with a topographic
image obtained simultaneously through the SPM. Therefore, a correlative analysis
between chemical information and morphology of sample is also possible. Although
the fundamental principle can be similar to SERS, practically TERS has strong
advantages owing to the spatial confinement and the position controllability of the
near-field light. As already mentioned, the typical spatial resolution in TERS imaging
is about 10–20 nm, and even a spatial resolution of single molecular level is possible
under certain conditions.