

200
B. P. Majee and A. K. Mishra
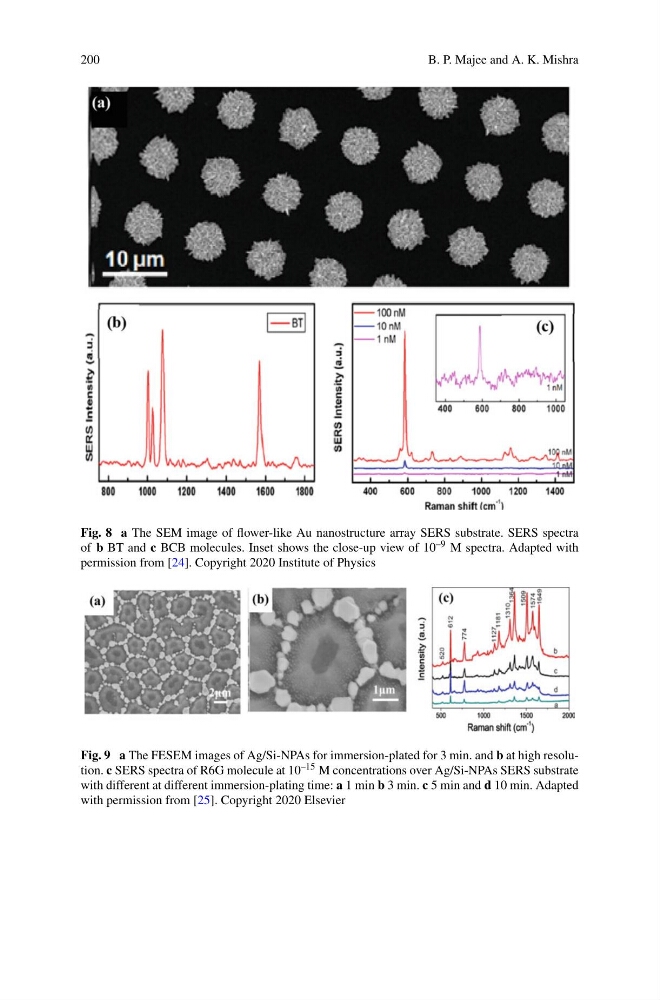
Fig. 8 a The SEM image of flower-like Au nanostructure array SERS substrate. SERS spectra
of b BT and c BCB molecules. Inset shows the close-up view of 10 –9 M spectra. Adapted with
permission from [24]. Copyright 2020 Institute of Physics
Fig. 9 a The FESEM images of Ag/Si-NPAs for immersion-plated for 3 min. and b at high resolution. c SERS spectra of R6G molecule at 10 –15 M concentrations over Ag/Si-NPAs SERS substrate
with different at different immersion-plating time: a 1 min b 3 min. c 5 min and d 10 min. Adapted
with permission from [25]. Copyright 2020 Elsevier
B. P. Majee and A. K. Mishra
Fig. 8 a The SEM image of flower-like Au nanostructure array SERS substrate. SERS spectra
of b BT and c BCB molecules. Inset shows the close-up view of 10 –9 M spectra. Adapted with
permission from [24]. Copyright 2020 Institute of Physics
Fig. 9 a The FESEM images of Ag/Si-NPAs for immersion-plated for 3 min. and b at high resolution. c SERS spectra of R6G molecule at 10 –15 M concentrations over Ag/Si-NPAs SERS substrate
with different at different immersion-plating time: a 1 min b 3 min. c 5 min and d 10 min. Adapted
with permission from [25]. Copyright 2020 Elsevier