

96
S. Roy et al.
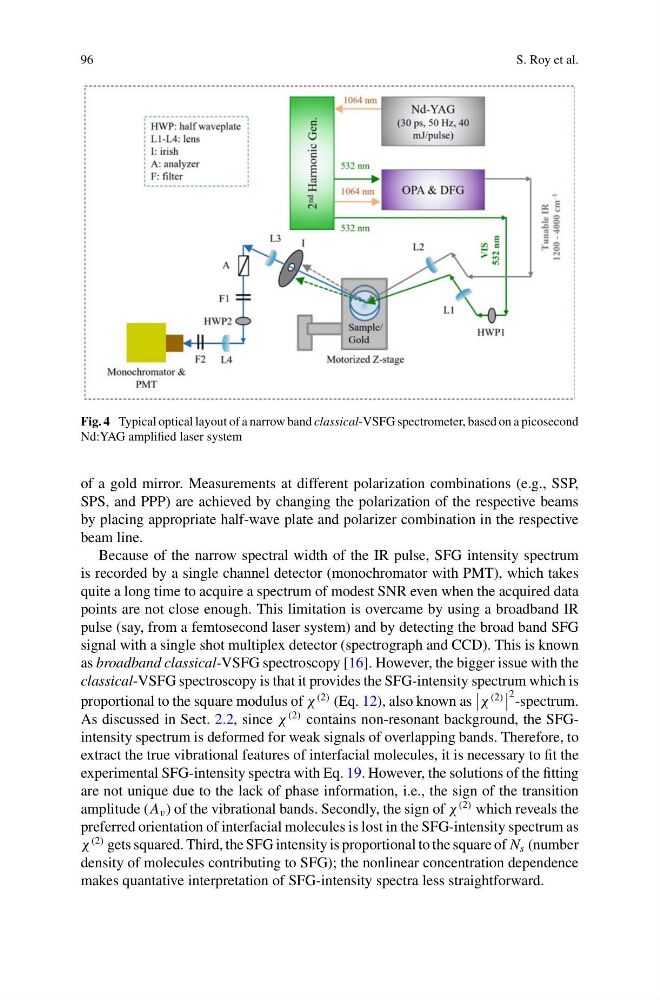
Fig. 4 Typical optical layout of a narrow band classical-VSFG spectrometer, based on a picosecond
Nd:YAG amplified laser system
of a gold mirror. Measurements at different polarization combinations (e.g., SSP,
SPS, and PPP) are achieved by changing the polarization of the respective beams
by placing appropriate half-wave plate and polarizer combination in the respective
beam line.
Because of the narrow spectral width of the IR pulse, SFG intensity spectrum
is recorded by a single channel detector (monochromator with PMT), which takes
quite a long time to acquire a spectrum of modest SNR even when the acquired data
points are not close enough. This limitation is overcame by using a broadband IR
pulse (say, from a femtosecond laser system) and by detecting the broad band SFG
signal with a single shot multiplex detector (spectrograph and CCD). This is known
as broadband classical-VSFG spectroscopy [16]. However, the bigger issue with the
classical-VSFG spectroscopy is that it provides the SFG-intensity spectrum which is
proportional to the square modulus of χ
(2) (Eq. 12), also known as
χ
(2)
2 -spectrum.
As discussed in Sect. 2.2, since χ
(2) contains non-resonant background, the SFGintensity spectrum is deformed for weak signals of overlapping bands. Therefore, to
extract the true vibrational features of interfacial molecules, it is necessary to fit the
experimental SFG-intensity spectra with Eq. 19. However, the solutions of the fitting
are not unique due to the lack of phase information, i.e., the sign of the transition
amplitude ( A v ) of the vibrational bands. Secondly, the sign of χ
(2) which reveals the
preferred orientation of interfacial molecules is lost in the SFG-intensity spectrum as
χ
(2) gets squared. Third, the SFG intensity is proportional to the square of N s (number
density of molecules contributing to SFG); the nonlinear concentration dependence
makes quantative interpretation of SFG-intensity spectra less straightforward.
S. Roy et al.
Fig. 4 Typical optical layout of a narrow band classical-VSFG spectrometer, based on a picosecond
Nd:YAG amplified laser system
of a gold mirror. Measurements at different polarization combinations (e.g., SSP,
SPS, and PPP) are achieved by changing the polarization of the respective beams
by placing appropriate half-wave plate and polarizer combination in the respective
beam line.
Because of the narrow spectral width of the IR pulse, SFG intensity spectrum
is recorded by a single channel detector (monochromator with PMT), which takes
quite a long time to acquire a spectrum of modest SNR even when the acquired data
points are not close enough. This limitation is overcame by using a broadband IR
pulse (say, from a femtosecond laser system) and by detecting the broad band SFG
signal with a single shot multiplex detector (spectrograph and CCD). This is known
as broadband classical-VSFG spectroscopy [16]. However, the bigger issue with the
classical-VSFG spectroscopy is that it provides the SFG-intensity spectrum which is
proportional to the square modulus of χ
(2) (Eq. 12), also known as
χ
(2)
2 -spectrum.
As discussed in Sect. 2.2, since χ
(2) contains non-resonant background, the SFGintensity spectrum is deformed for weak signals of overlapping bands. Therefore, to
extract the true vibrational features of interfacial molecules, it is necessary to fit the
experimental SFG-intensity spectra with Eq. 19. However, the solutions of the fitting
are not unique due to the lack of phase information, i.e., the sign of the transition
amplitude ( A v ) of the vibrational bands. Secondly, the sign of χ
(2) which reveals the
preferred orientation of interfacial molecules is lost in the SFG-intensity spectrum as
χ
(2) gets squared. Third, the SFG intensity is proportional to the square of N s (number
density of molecules contributing to SFG); the nonlinear concentration dependence
makes quantative interpretation of SFG-intensity spectra less straightforward.